Companies & Stocks
Amazon in 2026: An Outstanding Business, but What Is the Stock Worth?
An evidence-led examination of Amazon, AWS, AI infrastructure spending and three illustrative discounted cash-flow scenarios.

Key takeaways
- AWS accounted for around 57% of Amazon's FY2025 operating income despite producing about 18% of sales.
- High infrastructure spending contributed to approximately −$7.6bn trailing free cash flow through June 2026.
- Q2 2026 reported investment valuation gains are not the same as recurring AWS operating cash returns.
- The illustrative DCF is highly sensitive to terminal value; around 80% of Base operating value lies beyond 2036.
- At the historical $262.45 reference price the Base illustration, including 50% of recorded investments, is approximately $170/share; it is not a certified all-in fair-value target.
- Valuing private AI holdings, financing, leases and dilution consistently remains crucial; investors should not confuse business quality with an attractive purchase price.
Executive summary: outstanding business, demanding valuation
Amazon combines a global marketplace, direct retail, advertising, subscriptions and AWS. FY2025 net sales were $716.924bn and operating income was $79.975bn; AWS generated approximately 18% of revenue and 57% of operating income. Q2 2026 AWS revenue grew around 36.8% year on year. Amazon FY2025 10-K and Q2 2026 10-Q.
The central investment question: strong operating profits do not guarantee shareholder cash returns when capital investment is unusually high. Free cash flow for the twelve months ending June 2026 was about −$7.6bn under Amazon's definition.
Valuation as of 19 October 2026: at a dated reference closing price of $262.45, an illustrative ten-year operating DCF plus recognition of 50% of the disclosed financial-investment portfolio yields approximately $170 per share under central assumptions. This is not a certified fair-value target and is highly sensitive to distant future cash flows, financing, dilution and complex private investments. The model does not establish an attractive margin of safety, but it does not prove that Amazon is definitively overvalued.
Research cutoff 19 October 2026; financial results through June 2026. All artwork is AI-generated illustration and does not document actual facilities.
Essential figures at a glance
| Measure | Reported figure | Period or qualification |
|---|---|---|
| Consolidated net sales | $716.924bn | FY2025 |
| Consolidated operating income | $79.975bn | FY2025 |
| Net income | $77.670bn | FY2025; includes non-operating items |
| Diluted earnings per share (EPS) | $7.17 | FY2025 |
| AWS net sales | $128.725bn | FY2025 |
| AWS operating income | $45.606bn | FY2025 |
| Q2 2026 AWS sales | Approximately $42.2bn | Three months to June 2026 |
| Q2 2026 consolidated operating income | $27.5bn | Three months to June 2026 |
| Operating cash flow | $161.4bn | Trailing 12 months to June 2026 |
| Company-defined free cash flow | −$7.6bn | Trailing 12 months to June 2026 |
Sources: Amazon FY2025 Form 10-K and Q2 2026 earnings release.
1. How Amazon makes money: five businesses under one name
First-party retail: buying, stocking and reselling
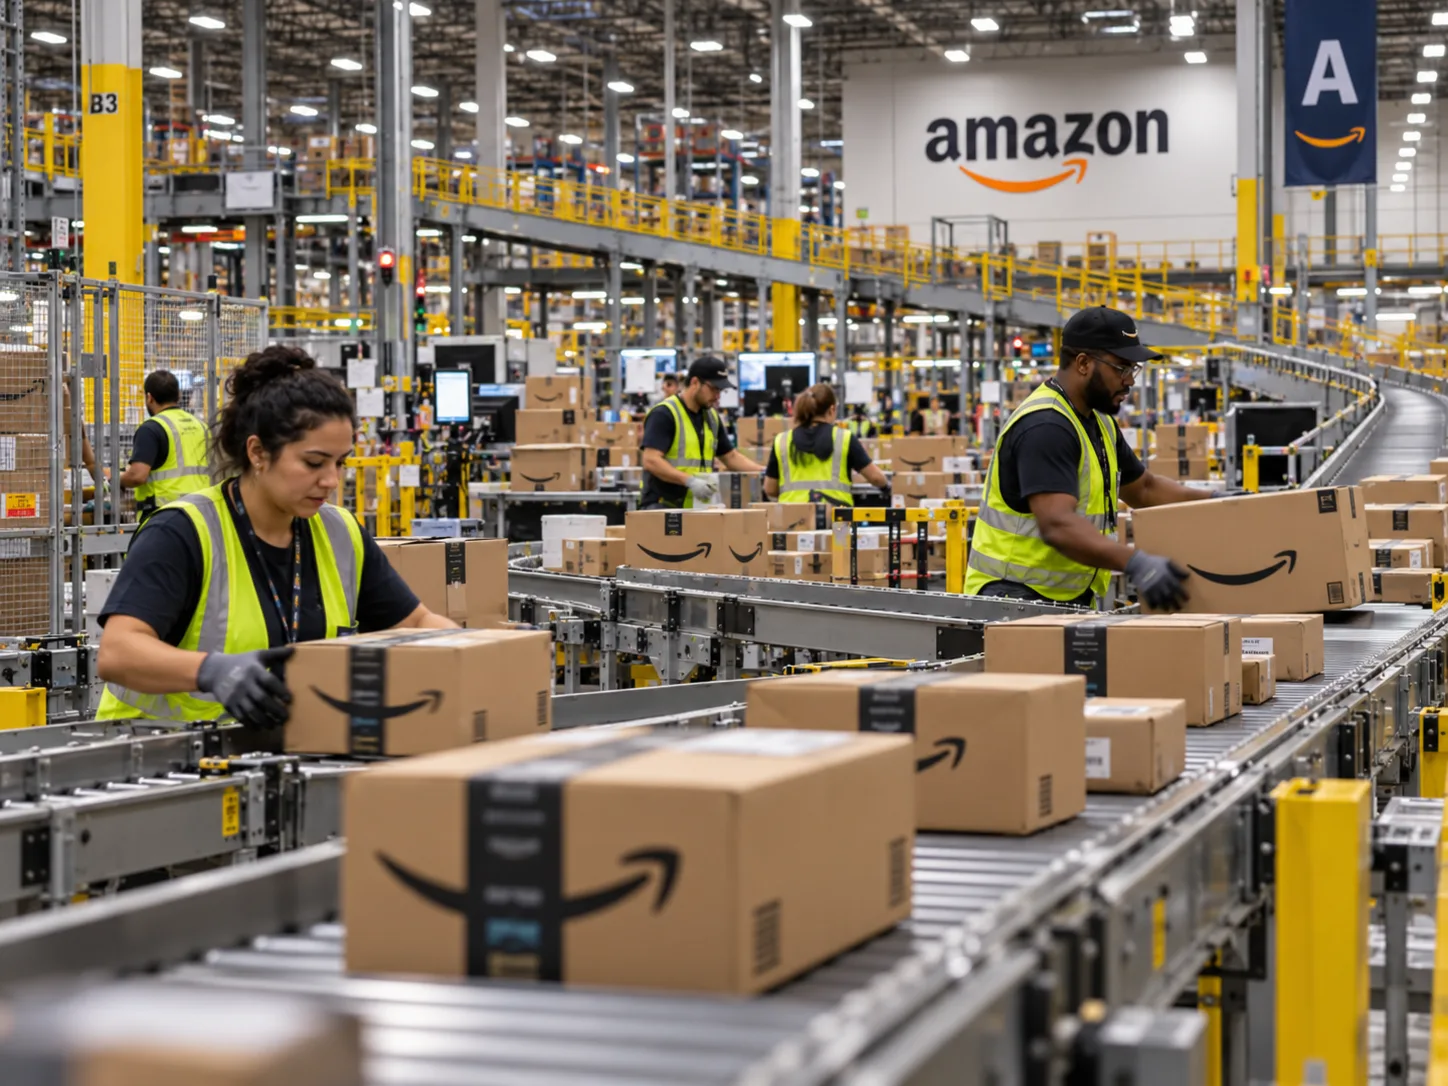
When Amazon buys a product from a supplier and sells it to a customer, Amazon generally records the selling price as product revenue. Suppose it buys a product for $60 and sells it for $100. The $40 difference before other expenses is not net profit: shipping, warehouse labour, payment processing, returns, marketing and technology still need to be paid for. Retail is operationally demanding, but convenience, selection and dependable delivery can increase shopping frequency.
Third-party marketplace: providing the platform
An independent merchant can own and sell inventory through Amazon's stores. Amazon may earn referral commissions, fulfilment and shipping fees, and advertising revenue. The merchant's full transaction amount is not automatically Amazon revenue. An illustrative $100 transaction might generate a $15 referral fee, a $6 fulfilment fee and an optional $3 advertising charge for Amazon. The hypothetical $24 is service revenue before associated expenses, not a measured company-wide take rate or profit.
This structure creates a reinforcing cycle: customer traffic attracts sellers, seller variety attracts customers, and merchants can purchase logistics and advertising services. However, marketplace fees, competition and regulatory restrictions could weaken that cycle.
Advertising: selling relevant visibility
Brands and merchants pay to appear in sponsored placements and other advertising formats. Advertising benefits from shopping intent and Amazon's ability to match promotions with customer searches. Amazon reports advertising revenue as a category, but does not disclose advertising as a stand-alone operating-profit segment. Any exact advertising operating margin quoted by an analyst is an estimate, not an audited segment figure.
Prime and subscriptions: recurring relationships
Prime and digital subscriptions strengthen engagement and can support repeat purchases. Subscription revenue is reported, but the total economics of Prime extend beyond the subscription fee: fast shipping, entertainment, customer retention and purchases across categories all matter. Treating subscription revenue as a standalone profit centre would overstate what Amazon discloses.
AWS: renting digital infrastructure
AWS sells compute capacity, storage, databases, networking, development tools and managed services. Businesses pay for infrastructure and services instead of building and operating everything themselves. Existing workloads can be expensive and complicated to migrate, creating switching costs. But the need to refresh servers, chips and power infrastructure makes cloud computing capital-intensive despite attractive reported operating margins.
2. Revenue composition: what grows and what earns profit
The following are Amazon's revenue categories, not separate profit-reporting segments.
| FY2025 revenue category | USD billions | Share of company sales |
|---|---|---|
| Online stores | 269.287 | 37.6% |
| Third-party seller services | 172.162 | 24.0% |
| AWS | 128.725 | 18.0% |
| Advertising services | 68.635 | 9.6% |
| Subscription services | 49.619 | 6.9% |
| Physical stores | 22.561 | 3.1% |
| Other | 5.935 | 0.8% |
| Total | 716.924 | 100.0% |
Source: FY2025 Form 10-K, Note 10, disaggregated net sales. Percentages are derived and rounded.
Why this matters: online stores and seller services generated nearly 62% of reported sales combined. Yet Amazon's largest disclosed operating-profit engine was AWS. A business's biggest sales category does not necessarily create its highest profit.
Official operating segments
Amazon reports segment sales and operating profit for North America, International and AWS.
| FY2025 operating segment | Net sales, USD bn | Operating income, USD bn | Operating margin |
|---|---|---|---|
| North America | 426.305 | 29.619 | 6.95% |
| International | 161.894 | 4.750 | 2.93% |
| AWS | 128.725 | 45.606 | 35.43% |
| Consolidated | 716.924 | 79.975 | 11.16% |
Source: FY2025 Form 10-K. Margin = segment operating income / segment net sales. AWS's $45.606bn / $79.975bn yields approximately 57.02% of consolidated operating income.
This profitability comparison is a powerful investment insight but must be interpreted carefully: reported segment operating margin is not the same as free cash flow margin or return on invested capital. Large server and data-centre investments can absorb cash long before they generate sufficient incremental earnings.
3. Ten years of Amazon's financial transformation
A longer history matters because Amazon's recent profit acceleration should not be projected into the future without understanding earlier downturns. The following reported annual sales and operating-income figures come from Amazon's Forms 10-K for 2018, 2019, 2022 and 2025. Operating margin is calculated as operating income divided by reported annual net sales.
| Calendar year | Revenue, USD bn | Operating income, USD bn | Operating margin |
|---|---|---|---|
| 2016 | 135.987 | 4.186 | 3.1% |
| 2017 | 177.866 | 4.106 | 2.3% |
| 2018 | 232.887 | 12.421 | 5.3% |
| 2019 | 280.522 | 14.541 | 5.2% |
| 2020 | 386.064 | 22.899 | 5.9% |
| 2021 | 469.822 | 24.879 | 5.3% |
| 2022 | 513.983 | 12.248 | 2.4% |
| 2023 | 574.785 | 36.852 | 6.4% |
| 2024 | 637.959 | 68.593 | 10.8% |
| 2025 | 716.924 | 79.975 | 11.2% |
Sources: Amazon FY2018 Form 10-K, FY2019, FY2022, and FY2025. Series reproduced from the revised owner-supplied research report dated 19 October 2026; values should receive final cell-by-cell source reconciliation before publication.
Amazon's sales rose from $136.0bn in 2016 to $716.9bn in 2025. That represents a nine-interval compound annual growth rate of approximately 20.3%, not evidence that 20% is sustainable indefinitely. Operating income climbed from roughly $4.2bn to $80.0bn, but it was not a smooth progression. In 2022, operating income dropped to about $12.2bn before the recovery visible in 2023–2025.
Operating margin expanded from approximately 3.1% to 11.2%. Even small differences in future margins matter against a revenue base above $700bn. Yet high operating earnings do not automatically create free cash flow if additional assets absorb even more cash.
Recent EPS and share dilution
| Metric | 2023 | 2024 | 2025 |
|---|---|---|---|
| Net income, USD bn | 30.425 | 59.248 | 77.670 |
| Diluted EPS, USD | 2.90 | 5.53 | 7.17 |
| Weighted diluted shares, bn | 10.492 | 10.721 | 10.827 |
Source: FY2025 Form 10-K, consolidated income and EPS disclosures. Reported EPS includes non-operating items and is not a normalized recurring-earnings measure.
The per-share perspective
EPS, or earnings per share, is net income attributable to common shareholders divided by the weighted average diluted number of shares. Dilution matters because shareholders own a fraction of the enterprise, not a fixed share of total company profits. Amazon's diluted weighted average share count increased between 2023 and 2025, so per-share growth did not exactly match growth in total net income.
A simplified example illustrates the effect. If a firm earns $1bn with 100 million diluted shares, EPS is $10. With 110 million shares and unchanged profits, EPS falls to approximately $9.09. That is why stock-based compensation, buybacks and share issuance require attention even when consolidated profit rises.
4. AWS: the crown jewel, but also a capital-intensive machine
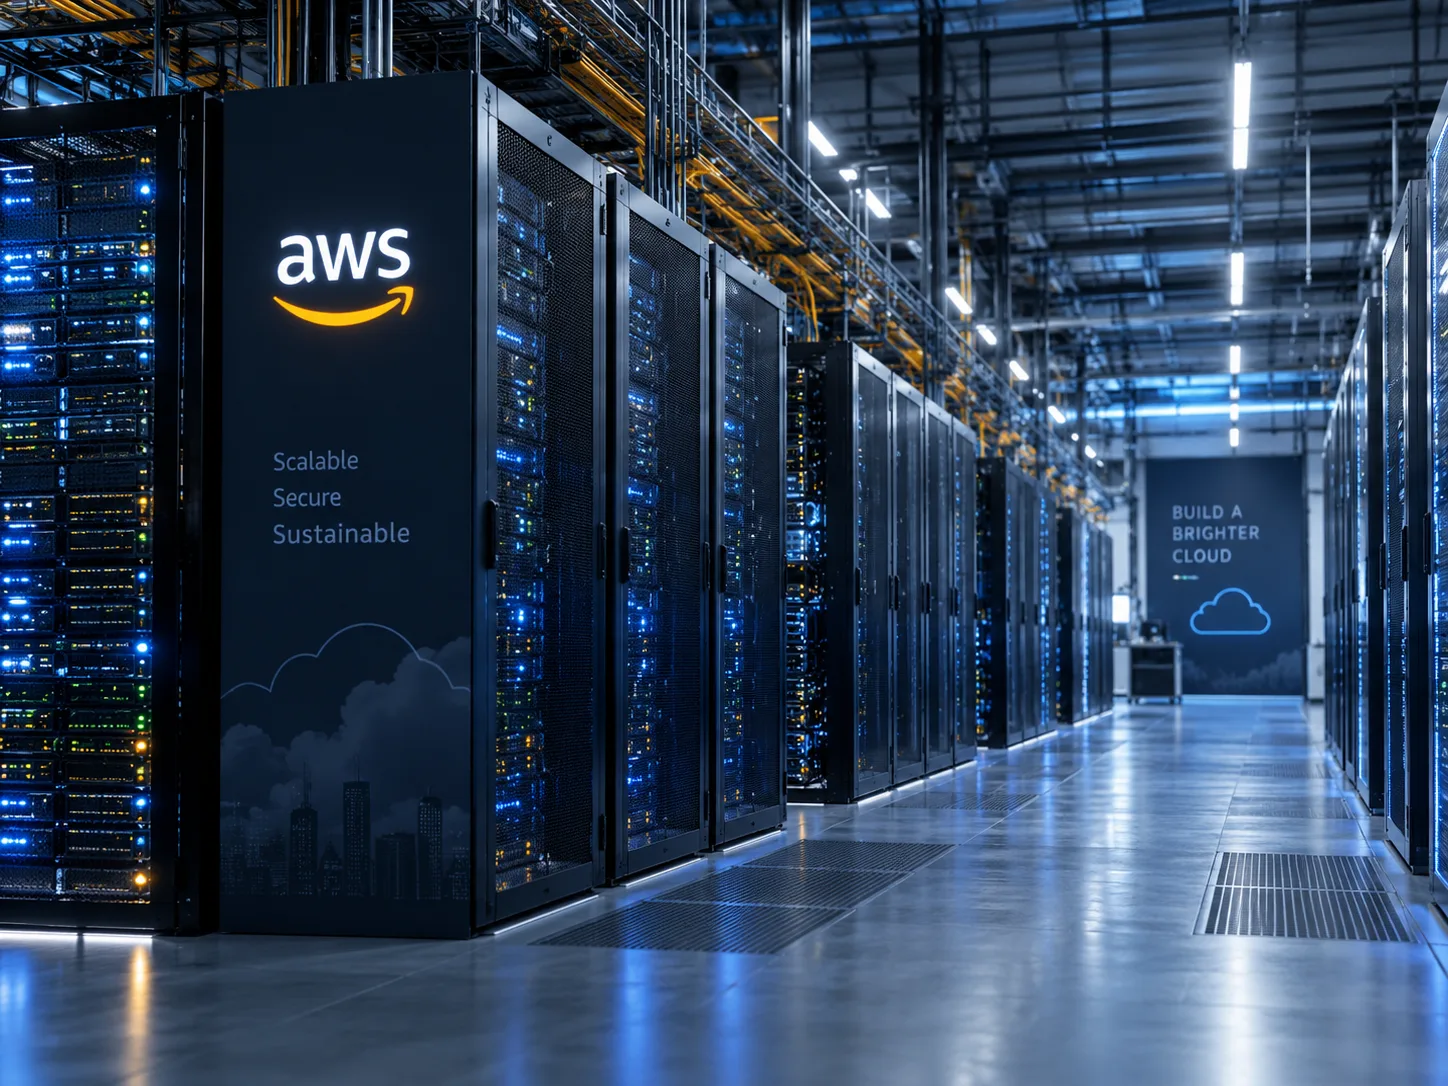
AWS serves organisations ranging from start-ups to multinationals. Its revenue comes from running applications, storing data, managing databases, network services, artificial intelligence tools and other infrastructure. Customers may gain flexibility and scalability, while AWS benefits from extensive service integrations and a large installed base.
AWS revenue increased from approximately $90.8bn in 2023 to $128.7bn in 2025. Over those two years, its segment operating margin rose from around 27.1% to 35.4%, according to the company figures in the source PDF and FY2025 filing. This is a meaningful improvement in reported operations.
Momentum accelerated in Q2 2026: AWS revenue was roughly $42.2bn, up about 37% year on year, with operating income of about $16.6bn. Quarterly margin was therefore about 39.3%. One quarter is not a reliable permanent-margin forecast. Amazon Q2 2026 earnings.
What AWS competes against
Microsoft Azure, Google Cloud, Oracle Cloud Infrastructure and specialist AI infrastructure providers compete on price, technical capability, reliability, security and specialised computing. Be careful with seemingly simple cloud-market-share tables: analysts may define the market differently, and company-reported segments do not always cover identical services.
The strongest evidence of AWS's competitive position is not simply its size. It is whether AWS can keep customers, grow useful workloads, maintain acceptable prices and earn incremental profit after the true cost of infrastructure.
AWS revenue and profitability through the cycle
The revised research provides reported annual AWS revenue for 2019–2025. It demonstrates why analysing one quarter alone is insufficient. The AWS margin series also changed: roughly 26% in 2019, around 30% in 2020–2021, approximately 27% in 2023, then roughly 37% in 2024 and 35.4% in 2025. Those are operating margins, not returns on the entire capital invested in cloud assets. Sources: Amazon's FY2019, FY2022 and FY2025 filings.
The questions that matter more than cloud hype
Is growth coming from sustainable customer demand? Are existing data centres operating near productive utilisation? Will customers migrate more workloads onto Amazon's proprietary chips? Can AWS retain pricing power while other cloud operators invest heavily? How much additional depreciation and replacement expense will follow today's installations?
The answers determine whether high reported operating margins translate into attractive returns on capital for shareholders.
5. Artificial intelligence, Anthropic and the investment cycle
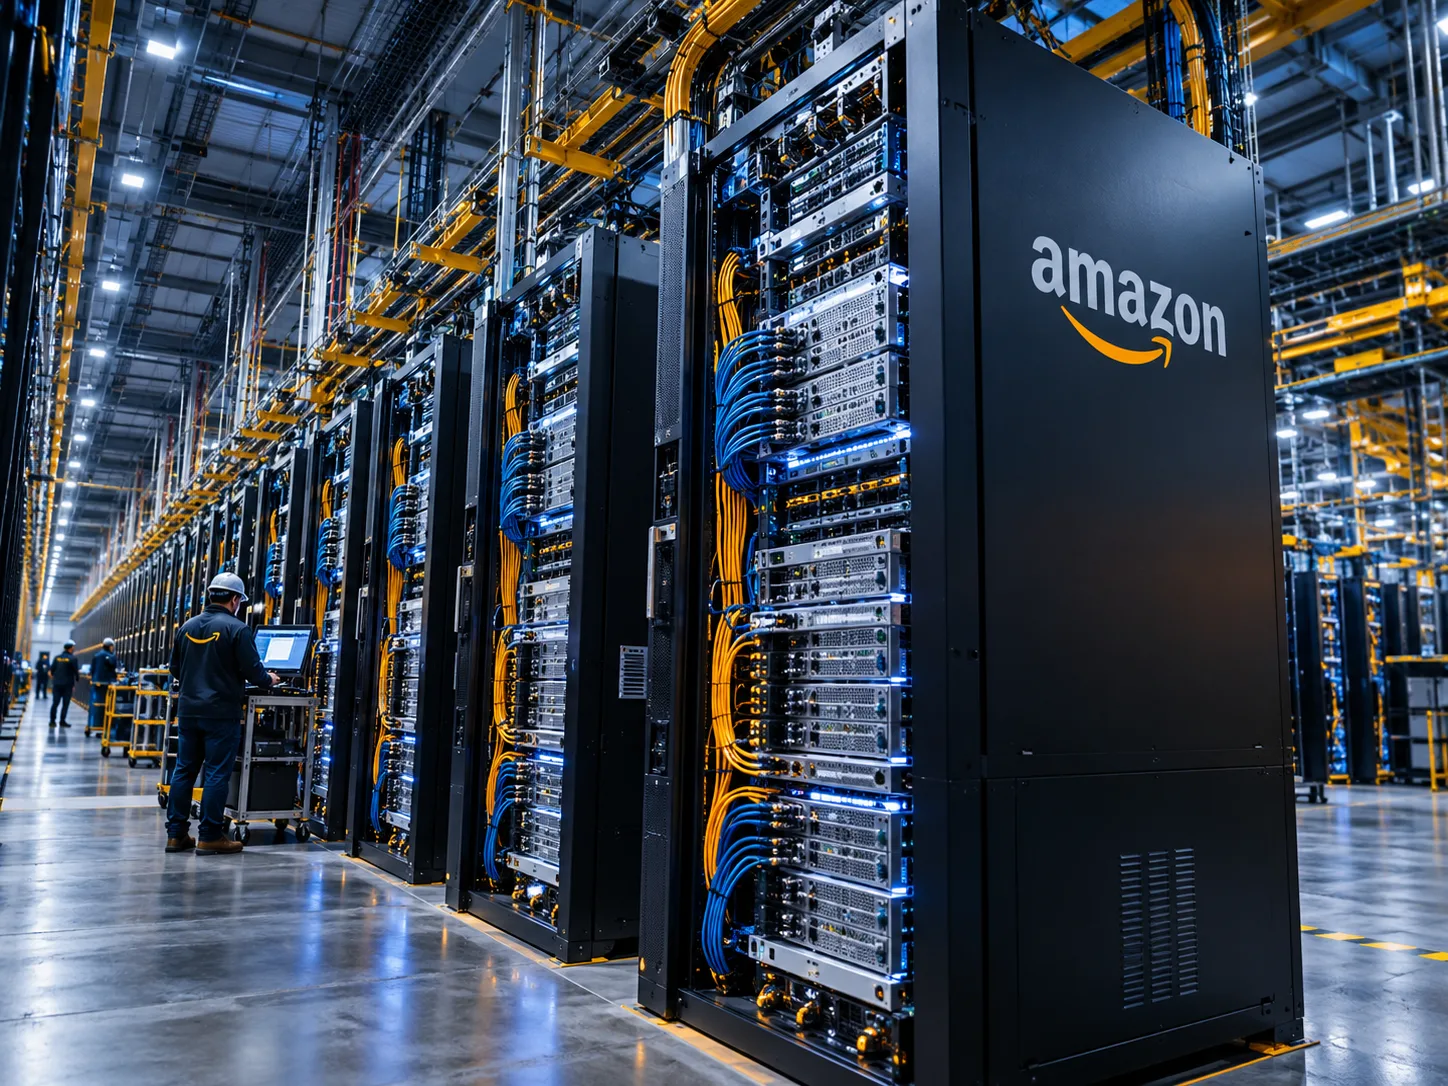
Amazon's AI strategy spans custom hardware such as Trainium and Graviton, services such as Bedrock, AI computing capacity, and automation across logistics and retail. These efforts may create revenue streams and reduce some unit costs. But building AI infrastructure requires large initial payments for chips, servers, electrical capacity, construction and networking.
In Q2 2026, management reported AWS growth supported by AI and core cloud services. Amazon also reported $53.4bn in pre-tax non-operating other income, principally tied to investment valuation effects, against $27.5bn in operating income. Q2 2026 release.
These are very different categories. If a private investment rises in its reported carrying value, accounting income can increase without Amazon receiving equivalent cash proceeds. Such effects can make headline net income — and a P/E ratio based on it — look stronger than underlying recurring operations justify.
A serious AI investment thesis needs the following chain to hold over time:
Capex → deployed capacity → paid customer usage → recurring margin → after-tax operating return → free cash flow per diluted share.
Breaking the chain at any point can undermine the thesis. Installed equipment may be underused; prices may decline; customers may negotiate discounts; chips may require earlier replacement; electric-power constraints may delay commissioning.
As reported by Reuters after the July 2026 results, Amazon raised its 2026 capital spending plan to approximately $220bn. This is a management intention reported at the time, not the same as historical cash capex or audited year-end spending. Reuters, 30 July 2026.
6. Cash flow: why profit and cash tell different stories
Operating cash flow is cash generated through the business after relevant operating cash movements. Capital expenditure purchases assets expected to serve the company across future periods. Free cash flow (FCF) is broadly the amount left after a defined measure of investment, but definitions differ across companies.
| Measure, USD bn | FY2024 | FY2025 | TTM June 2026 |
|---|---|---|---|
| Operating cash flow | 115.877 | 139.514 | 161.403 |
| Net cash capex | 77.658 | 128.320 | 169.007 |
| Amazon-defined FCF | 38.219 | 11.194 | −7.604 |
Sources: FY2025 filing and Q2 2026 filing. TTM means trailing twelve months; it is not a third comparable financial year and must not be added to FY2025.
The lesson is striking: operating cash generation increased while FCF declined. For the TTM period through June 2026, capex exceeded operating cash flow under Amazon's reported definition. That can be reasonable if infrastructure projects earn future returns above the capital cost; it can also create a risk if AI demand, prices or utilisation disappoint.
Amazon's definition of FCF is useful but not exhaustive. Finance leases, equipment obtained under financing structures and other contractual commitments affect total economic investment. A complete valuation must avoid both undercounting investment and double-counting liabilities.
Maintenance versus growth investment
Maintenance investment supports existing service levels. Growth investment expands capacity. The source materials do not provide a reliably audited decomposition for Amazon's entire investment programme. Consequently, an analyst should not invent a precise maintenance-capex figure and use it to make cash flow appear higher. Modelling alternatives can be disclosed as assumptions instead.
Return on invested capital: what does the spending earn?
ROIC (return on invested capital) measures after-tax operating profit relative to capital deployed in a business. A common analytical definition is ROIC = NOPAT / average invested capital, where NOPAT represents net operating profit after taxes. Definitions vary depending on leases, goodwill, cash, liabilities and investments.
The revised source report illustrates a simplified screen for FY2025: approximately $80.0bn operating profit × (1 − assumed 21% tax rate) = $63.2bn illustrative NOPAT. It uses estimated invested-capital proxies of $237.4bn for 2024 and $353.7bn for 2025, averaging $295.6bn, to produce a ratio near 21.4%.
Important: 21.4% is an educational, unadjusted ROIC proxy, not Amazon's reported or independently certified economic ROIC. Its capital denominator uses shareholders' equity plus long-term debt less cash and marketable securities, before full treatment of certain leases, short-term financing, non-operating holdings and other accounting adjustments. The assumed operating tax rate is likewise not a claim about Amazon's observed marginal cash tax rate. The proxy should not be mechanically compared with another company's differently defined ROIC or with a WACC computed on incompatible assumptions.
The more decision-useful forward-looking question is incremental ROIC: how much additional sustainable after-tax operating profit is created by new capital? For illustration, if $100bn of new economic capital produced a 10% incremental after-tax operating return, that would imply $10bn of additional annual NOPAT. Whether Amazon's actual investments achieve that outcome remains unproven. Evaluate AWS growth, margins, depreciation, capex, utilisation and cash generation together.
7. Balance sheet, debt, leases and financial resilience
The source PDF reports approximately $123bn of unrestricted cash, cash equivalents and marketable securities at 30 June 2026, based on its reading of the quarterly filing. That is a substantial liquidity resource, but not an all-purpose estimate of net cash or equity value.
Debt, finance leases, operating leases, financing obligations and other claims must be classified consistently. In enterprise valuation, the treatment of lease-related payments in forecast cash flow must match the treatment of leases in the debt bridge. Otherwise, the same economic cost can be counted twice — or omitted.
Investors should examine debt maturities, interest expense, lease schedules, capital commitments, investment holdings and the ability to finance operations if demand slows while construction continues. An apparently healthy balance sheet is not a reason to disregard future cash demands.
8. Does Amazon pay dividends, and how do shareholders benefit?
The financial filings used here do not establish a regular Amazon cash dividend programme, and the historical investment proposition has centred on reinvestment rather than dividend distributions. Before public release, the latest board announcements should be checked again so the article can give a fully dated yes/no answer.
A shareholder can benefit without dividends if future cash-generating power per share rises and buyers are willing to pay for it. But price appreciation is not guaranteed: business performance, dilution, investor expectations and the price paid all matter.
Amazon can theoretically allocate capital to infrastructure, acquisitions, debt reduction, repurchases or dividends. The correct question is not merely whether it could pay a dividend, but which use offers the best risk-adjusted return for owners.
Any share-repurchase claim must be compared with employee share issuance. Gross repurchase spending does not necessarily mean that the diluted share count has decreased.
9. Competition, governance and regulation
Amazon's operating advantages include convenience, selection, distribution scale, seller network effects, customer relationships and AWS switching costs. These form an economic moat: a set of advantages that may help the business maintain profitability. They are meaningful, but not permanent.
Retail competitors can compete on price, shipping or differentiated products. Marketplace sellers may resist fees or policy changes. AWS faces competition from large clouds and specialist AI infrastructure providers. Regulators may challenge marketplace practices, advertising arrangements, labour conditions and data practices.
Amazon is led by Andy Jassy, while Jeff Bezos remains an influential founder and shareholder. An effective governance review should judge management by capital allocation, incentives, dilution, measured operating execution, public accountability and returns on invested capital — not fame or reputation.
The company's 10-K discusses extensive risks surrounding sellers, competition, security, policy and international trade. Amazon FY2025 risk disclosures.
Peer comparison: Amazon, Microsoft, Alphabet and Walmart
Comparing only headline company margins would be misleading because these firms have fundamentally different business mixes. Nevertheless, a consolidated-company comparison provides useful context.
| Company and fiscal period | Revenue, USD bn | Operating income, USD bn | Operating margin |
|---|---|---|---|
| Amazon FY2025 | 716.9 | 80.0 | 11.2% |
| Microsoft FY2025 (June year-end) | 281.7 | 128.5 | 45.6% |
| Alphabet FY2025 | 402.8 | 129.0 | 32.0% |
| Walmart FY2026 (January year-end) | 713.2 | 29.8 | 4.2% |
Sources: Amazon FY2025 10-K, Microsoft annual report, Alphabet 2025 Form 10-K and Walmart FY2026 results.
The fiscal year-ends differ, and Microsoft's software business, Alphabet's advertising business and Walmart's retail stores shape their margins. Do not compare AWS's segment operating margin directly with Microsoft or Alphabet's whole-company margins and call it a cloud-industry ranking. A like-for-like cloud comparison would require reconciling competitor segment boundaries and accounting treatment.
10. Which risks could change the investment case?
| Risk | Financial mechanism | Evidence to monitor |
|---|---|---|
| Excess AI capacity | Underutilised servers and depreciation undermine returns | AWS growth, operating margin, capex, utilisation disclosures |
| Cloud competition | Discounts or lost workloads limit profits | AWS revenue growth and segment margin |
| Retail cost inflation | Shipping, wages, returns and fulfilment costs exceed productivity gains | North America and International margins |
| Antitrust and other regulation | Fines, litigation expenses or structural changes | Official court records, regulatory filings |
| Investment revaluation | Non-cash gains reverse, or private holdings prove illiquid | Investment notes, impairments and realised exits |
| Balance-sheet commitments | Financing and lease payments create cash pressure | Debt and lease maturities, cash commitments |
| Dilution | Earnings divided across a larger share count | Weighted diluted shares and employee awards |
| Recession | Consumer, advertising and cloud spending weaken | Orders, segment sales and working capital |
| Valuation compression | Share price falls even if operating profit rises | Market multiples and revised growth expectations |
These are risk mechanisms, not claims that every negative scenario is already unfolding. A disciplined analysis assigns probabilities only when there is defensible evidence and openly records the uncertainty.
11. Valuation: the 2027–2036 discounted cash-flow model
The share price is what a buyer pays; intrinsic value is an uncertain estimate of the cash flows attributable to shareholders. The dated 19 October 2026 reference close was $262.45, not a live quote. Our 2026 revenue starting point of $835bn is an analyst assumption, not Amazon's reported FY2026 result or consensus.
Our unlevered FCFF model uses after-tax operating profit + depreciation − cash capex − change in working capital, discounts annual 2027–2036 flows at scenario-specific WACC, and applies a Gordon-growth terminal value. Revenue growth, margins and reinvestment are assumed, not observed.
Three operating scenarios
| Measure | Bear | Base | Bull |
|---|---|---|---|
| 2027 revenue assumption | $906bn | $939bn | $969bn |
| WACC | 10.50% | 9.50% | 8.75% |
| Terminal growth | 2.50% | 3.00% | 3.50% |
| PV of explicit 10-year cash flows | $30bn | $358bn | $810bn |
| PV of terminal value | $517bn | $1,407bn | $3,297bn |
| Operating enterprise value | $547bn | $1,765bn | $4,107bn |
| Terminal value as % of operating EV | 94.6% | 79.7% | 80.3% |
What terminal value means: although the forecast stops at 2036, Amazon would not necessarily stop operating then. The terminal value represents all subsequent anticipated cash flows. In the Base case, roughly four of every five dollars of value depend on the period beyond the explicit forecast. Changes in perpetual growth, reinvestment requirements or discount rate can substantially change the result.
From operating value to equity value
The simplified 30 June 2026 bridge adds $122.993bn in cash and marketable securities and subtracts $128.894bn of long-term debt, $0.325bn of other short-term borrowings, $13.451bn in finance lease liabilities and $9.315bn of financing obligations. The net adjustment before separate investment assets is −$28.992bn.
Amazon's Q2 2026 filing identifies $229.7bn of recorded investments comprising equity, warrants and convertible instruments in public and private entities, including AI-related holdings. They have differing rights and valuation uncertainty; their book values are not immediately spendable cash. The company disclosed further investment funding after the June reporting date. Do not add overlapping investment categories together, or value post-quarter assets without accounting for the corresponding funding. Amazon Q2 2026 10-Q.
Because individual instrument valuations cannot reliably be inferred, we illustrate a range of recoverability assumptions:
| Shareholder value per diluted share if recoverable investment value is… | Bear | Base | Bull |
|---|---|---|---|
| 0% of recorded portfolio | $48 | $159 | $374 |
| 25% | $53 | $165 | $379 |
| 50% | $58 | $170 | $385 |
| 75% | $63 | $175 | $390 |
| 100% | $69 | $180 | $395 |
The central value of $170 per share is about 35% below the dated reference price within this model, but this is not proof of 35% real-world overvaluation. The model uses 10.9bn assumed diluted shares, June rather than October balance-sheet inputs and incomplete instrument-specific recovery estimates. It excludes a fully reconciled pro-forma assessment of all obligations. Operating leases and future contractual commitments must be handled consistently with forecast expenses and capex to avoid double counting.
What could change the assessment? Strong and durable AWS growth, improved free cash flow after infrastructure spending, attractive returns on incremental invested capital and a lower entry price could strengthen the case. Higher financing costs, overbuilt capacity, weaker margins, private-investment impairments and shareholder dilution could weaken it.
Editorial verdict: Excellent operating business; no demonstrated margin of safety at $262.45 under the illustrated assumptions. These are analytical scenarios, not certified price targets or personalised investment advice.
12. What the next decade could look like
A constructive 2027–2035 trajectory would include durable AWS demand, profitable AI services, greater cloud utilisation, improved fulfilment productivity and rising cash flow per diluted share after reinvestment. A less favourable path would combine growing revenue with persistently high infrastructure spending, technological obsolescence and weak incremental investment returns.
Amazon could remain a commercially essential business in either case. What differs is the value available to shareholders relative to the price they paid. The key variables are future cash generation and the cost of achieving it.
Questions for every earnings release
Monitor AWS revenue growth together with operating margin, reported and lease-adjusted capex, depreciation trends, free cash flow, share dilution, retail segment margins, cash obligations and the status of major investment holdings. A single attractive quarter or headline EPS figure should never replace this full picture.
13. Frequently asked investor questions
Is Amazon just an online retailer? No. AWS, merchant services, advertising and subscriptions are important revenue and profit drivers, and several operate differently from first-party retail.
Where does Amazon earn most revenue? Online stores are the largest individually disclosed revenue category in FY2025, but North America is the largest official operating segment.
Which segment produces the most operating profit? AWS, with approximately 57% of FY2025 consolidated operating income.
Does Amazon disclose advertising profit? No separate audited advertising operating-profit segment is provided, so claimed advertising margins are estimates.
What was diluted EPS in FY2025? $7.17, reflecting reported net income rather than a fully normalised measure of recurring profitability.
Why was Q2 2026 net income unusually high? It included large pre-tax non-operating investment valuation gains, principally tied to Anthropic.
Is negative FCF evidence that Amazon is insolvent? No. It shows cash investment exceeded operating cash generation under the reported FCF definition during the stated period; ongoing funding requirements and future returns still matter.
Does Amazon have debt? Yes. A sound analysis must also consider leases, financing commitments, cash and investments.
Does Amazon pay a regular dividend? The filings reviewed do not establish a regular programme; recheck current investor-relations notices before final publication.
Can Amazon stock perform poorly even if AWS keeps growing? Yes. Future returns also depend on capex, profitability, dilution, risks and the valuation paid for the shares.
Is Amazon attractive at the dated $262.45 reference price? The illustrative central DCF including a 50% recognition of recorded financial investments is around $170 per share. That model does not demonstrate a margin of safety, but the estimate is not a certified consolidated equity fair value and should not be interpreted as a definitive sell recommendation.
14. Methodology and verification boundaries
Reporting dates: Historical company statements are through FY2025, the latest reviewed quarterly reporting ends June 2026, and the market price reference is dated 19 October 2026. Annual and trailing-twelve-month figures are distinct, not additive.
Historical series: Revenue, operating profit and cash-flow information are drawn from Amazon's historical annual and quarterly filings. Some historical chart observations have not been independently checked cell-by-cell in this editorial pass; readers should use the linked filings as primary evidence rather than treat chart labels as independently certified.
Valuation inputs: All projected 2026–2036 revenues, operating margins, taxes, capex, depreciation, working capital, discount rates, terminal growth, recovery fractions and diluted-share counts are assumptions. Three CSV files described in the owner's research PDF contain the model's annual values and sensitivities, but were not supplied with this website update. Do not call the model independently audited or offer those files as downloads until the originals are actually uploaded and checked.
Image provenance: The cover and six inline pictures are original AI-generated concept illustrations, not photographs of verified real-world Amazon sites or equipment; no affiliation or endorsement is implied.
Educational purpose: Independent general financial research, not tailored investment advice. No future return is guaranteed.
Amazon revenue, 2016–2025
Reported consolidated net sales from historical Amazon 10-Ks. Latest values are actuals, not forecasts.
- 2016135.99 USD billions
- 2017177.87 USD billions
- 2018232.89 USD billions
- 2019280.52 USD billions
- 2020386.06 USD billions
- 2021469.82 USD billions
- 2022513.98 USD billions
- 2023574.79 USD billions
- 2024637.96 USD billions
- 2025716.92 USD billions
Amazon operating income, 2016–2025
Annual consolidated operating income; the 2022 decline illustrates that growth has not been smooth. Source: Amazon Forms 10-K 2018, 2019, 2022 and 2025.
- 20164.19 USD billions
- 20174.11 USD billions
- 201812.42 USD billions
- 201914.54 USD billions
- 202022.9 USD billions
- 202124.88 USD billions
- 202212.25 USD billions
- 202336.85 USD billions
- 202468.59 USD billions
- 202579.98 USD billions
AWS operating margin, 2019–2025
Approximate historical percentages from Amazon segment disclosures and revised research PDF; derived as AWS operating income divided by AWS segment revenue.
- 201926.3 Percent
- 202029.9 Percent
- 202129.9 Percent
- 202228.5 Percent
- 202327.1 Percent
- 202436.9 Percent
- 202535.43 Percent
Cash capital expenditure, 2023–2025
Net cash purchases of property and equipment under Amazon's FCF definition; source Amazon 2025 annual report and preceding report.
- 202348.1 USD billions
- 202477.66 USD billions
- 2025128.32 USD billions
Amazon free cash flow, 2023–2025
Company-defined free cash flow in USD billions: operating cash flow minus net cash capex. Does not include every contractual cash obligation.
- 202336.8 USD billions
- 202438.22 USD billions
- 202511.19 USD billions
Sources & references
- Amazon FY2025 Form 10-K (SEC)
- Amazon Q2 2026 Form 10-Q (SEC)
- Amazon Q2 2026 earnings release
- Amazon Q2 2026 operating commentary
- Reuters — Amazon AI capex plan and AWS growth, 30 July 2026
- Amazon Investor Relations
- Amazon FY2018 Form 10-K
- Amazon FY2019 Form 10-K
- Amazon FY2022 Form 10-K
- Microsoft FY2025 annual report
- Alphabet FY2025 Form 10-K
- Walmart FY2026 results
- AMZN historical closing prices — 19 October 2026
Found an error? Contact us with the source and passage to correct.