Global Economy
The Global Economy in 2026: How the World Has Changed, What's Driving Growth, and What Comes Next
A data-led guide to the evolution of the world economy, its changing sectors, regional powers, trade, energy, AI, jobs and future risks.
Key takeaways
- The IMF's October 2026 outlook projects world real GDP growth of 3.1% in 2026 and 3.4% in 2027; these figures are forecasts, not observed final-year results.
- Global growth is uneven, and GDP does not automatically capture household affordability, wage gains or employment quality.
- Agriculture, industry and services are interconnected, while AI investment, electricity infrastructure and trade reorganisation are reshaping parts of the economy.
- WTO and IEA data show how fast-growing technology-related activity can influence trade and electricity demand without accounting for all underlying economic activity.
- The outlook to 2030–2040 is best presented through conditional scenarios rather than unsupported precise predictions.
Executive summary: resilience is not the same as prosperity for everyone
As of 18 October 2026, the world economy continues to grow, but its sources of growth and the distribution of gains are deeply uneven. A surge in AI-related capital expenditure has supported activity in particular technology supply chains, while energy-price shocks, public debt, geopolitical tensions and living-cost pressures have weighed on other economies. This is a world of simultaneous resilience and fragmentation—not a single global boom or recession.
The International Monetary Fund's October 2026 World Economic Outlook projects global real GDP growth of 3.1% in 2026 and 3.4% in 2027. These are forecasts, not final annual observations. The same report projects global headline inflation of 4.7% for 2026 and 4.1% for 2027. The IMF stresses that risks remain tilted toward the downside. Source: IMF, October 2026.
Three observations frame this report:
- Output can grow without equivalent gains in household wellbeing. GDP, real earnings, affordability and job quality describe different things.
- The sectors behind growth are changing. Digital infrastructure, electricity, advanced manufacturing and knowledge-intensive services are increasingly connected, but established sectors still account for most employment and output.
- Forecasts are conditional. Conflict, the price of energy, financial conditions, productivity and public policy could produce significantly different outcomes.
This analysis follows the global economy from its structural evolution to the situation in 2026, examining sectors, regions, labour, trade, technology and possible paths toward 2030–2040. Its aim is to explain what the evidence supports—and what remains uncertain.
1. How the world economy changed: from farms to factories to services
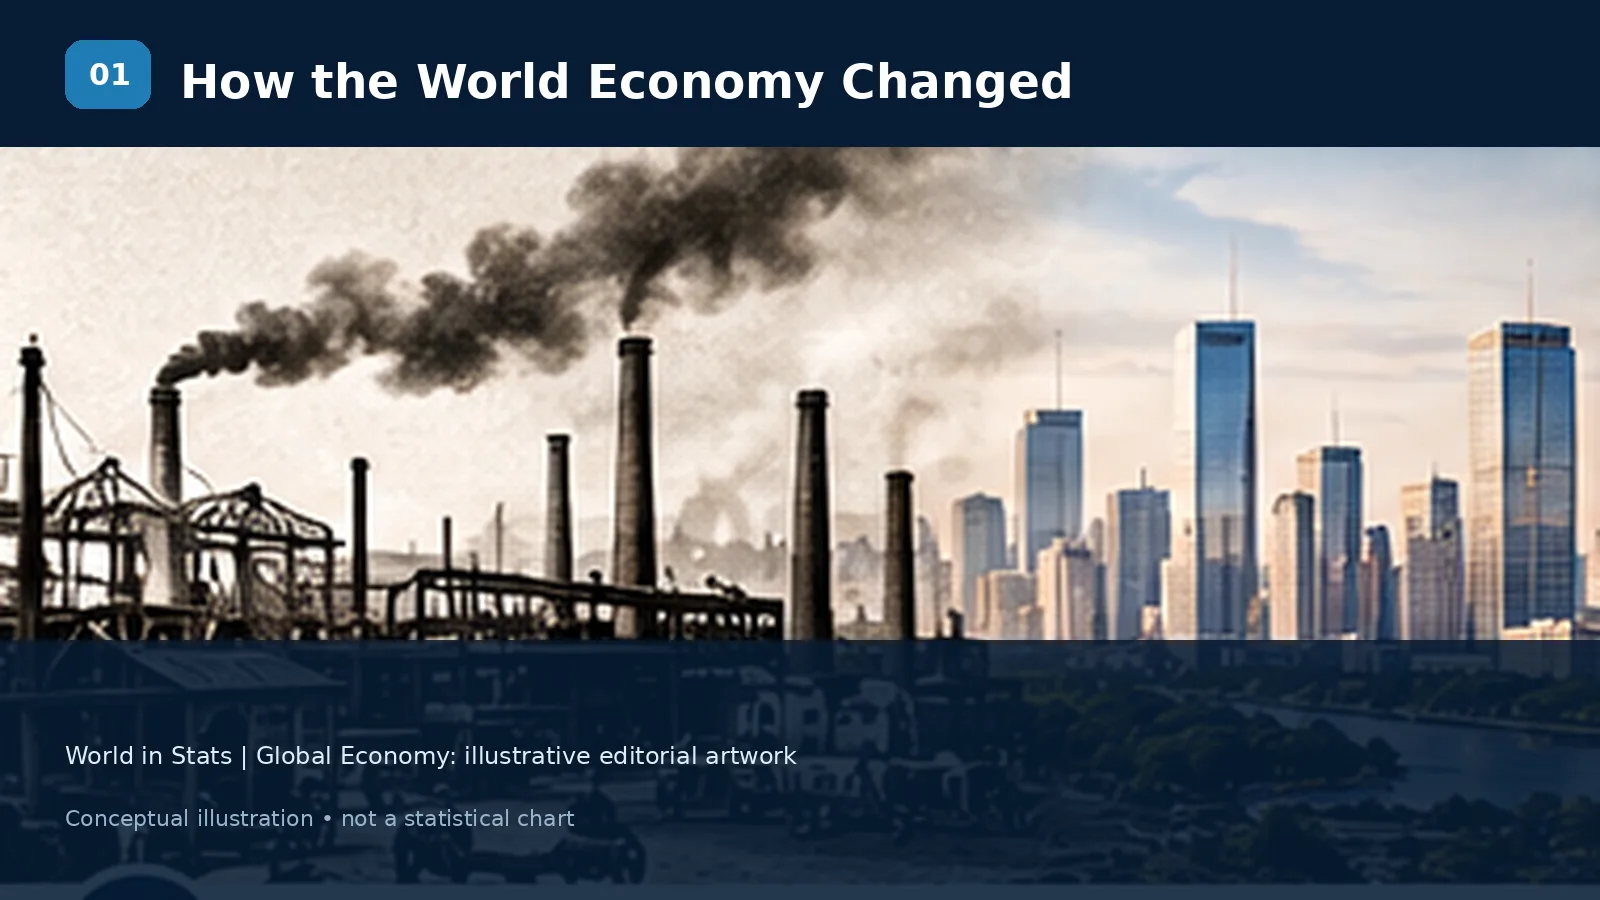
Economic history is not simply a sequence in which one sector replaces another. It is a story of higher productivity, urbanisation, greater specialisation and complex supply chains.
In predominantly agrarian economies, large shares of workers produced food and raw materials. Industrialisation increased output per worker through mechanisation, new energy sources, transport networks and the concentration of production in factories. Later, finance, retail, healthcare, education, professional services and digital activities became increasingly important in many high-income economies.
Yet agriculture did not disappear when its share of GDP declined. Farmers can produce more with fewer workers because of mechanisation, fertilisers, improved seeds, logistics and information. Similarly, declining manufacturing employment need not mean declining manufacturing output: automation can allow factories to produce more with fewer employees. Conversely, a growing services sector can include both highly productive technical services and low-paid informal activities.
The late twentieth century brought an acceleration of international trade, containerisation, cross-border investment and global production networks. China became central to global manufacturing supply chains, while service exports, information technology and business-process outsourcing expanded in other economies. The 2008–09 financial crisis and the COVID-19 shock revealed how interdependent these systems had become. More recently, trade tensions, supply-chain disruptions and geopolitical risks have encouraged businesses to diversify suppliers rather than rely on a single source.
Interpretation matters: a chart comparing sectors' shares of GDP is not a chart of sector employment, and neither is a complete measure of productivity. When preparing long historical charts, classification revisions and national-account methods must be documented.
2. What 2026 actually tells us—and what it cannot tell us yet
In October 2026, the calendar year is not finished. Readers should distinguish the latest observed monthly or quarterly releases, full-year 2025 estimates, and forecasts for 2026 and 2027.
The IMF's October projections of 3.1% world growth in 2026 and 3.4% in 2027 reflect available information through 1 October 2026. They are one institution's scenario-conditioned central estimates, not precise statements about future outcomes. The IMF flags persistent fiscal vulnerabilities, threats to financial stability, further escalation of conflict, changing expectations of AI profitability and trade tensions. Source: IMF World Economic Outlook.
It is also important not to merge projections made by different institutions as if they were the same series. The World Bank's June 2026 Global Economic Prospects publication projected 2.5% global growth in 2026, reflecting its own analytical framework, coverage, methodology and earlier information set. Comparing forecasts requires naming the issuing institution and vintage—not treating differences as calculation mistakes. Source: World Bank, June 2026.
The global inflation projection is likewise an aggregate; it does not mean every country experiences that inflation rate. Energy-importing countries, commodity exporters and economies with different monetary conditions face distinct pressures. A drop in inflation from one year to the next means the rate of price increases is easing; it does not by itself mean the price level is falling.
Snapshot: five indicators to interpret together
| Indicator | Latest cited value | Observation or forecast? | Interpretation |
|---|---|---|---|
| Global real GDP growth | 3.1% in 2026 | IMF forecast, October 2026 | Growth remains positive but uneven |
| Global real GDP growth | 3.4% in 2027 | IMF forecast, October 2026 | Expected recovery, not guaranteed |
| Global headline inflation | 4.7% in 2026 | IMF forecast, October 2026 | Price levels still rising on aggregate |
| World merchandise trade volume growth | 3.9% in 2026 | WTO forecast, October 2026 | Trade growth influenced by AI-related goods |
| Global unemployment rate | 4.9% in 2026 | ILO projection, January 2026 | Stable headline labour metric, not a measure of job quality |
Sources: IMF, WTO and ILO. Note the different report dates and definitions.
3. How to measure the global economy without misleading readers
Gross domestic product (GDP) measures production within an economy over a period, not the wealth of every household. Nominal GDP uses current prices and exchange rates; real GDP attempts to remove price changes. GDP per capita divides production by population but says nothing directly about how income is distributed. Purchasing power parity (PPP) comparisons adjust for differences in domestic price levels but involve estimation and benchmark-year choices.
These indicators serve different purposes:
- Real GDP growth: change in output volumes.
- Nominal GDP at market exchange rates: useful for some international financial comparisons, but affected by currency movements.
- GDP at PPP: useful for comparing the volume of domestic production and purchasing power across economies, with methodological caveats.
- Real household disposable income: more directly related to households' purchasing power than GDP.
- Median real wages, employment quality and poverty: illuminate distribution and living standards.
- Output per hour worked: a measure of labour productivity where comparable data exist.
A country can record positive growth while households feel worse off if living costs rise faster than incomes, the gains accrue disproportionately to a small group, population grows faster than output, or public and private services remain unaffordable. None of these outcomes can be established from GDP alone.
For every chart, state the unit, adjustment for inflation, reporting currency or PPP method, exact time period, geographic coverage and source vintage. Missing values must not be silently interpolated and then described as observed.
4. Agriculture: a smaller output share can still mean strategic importance
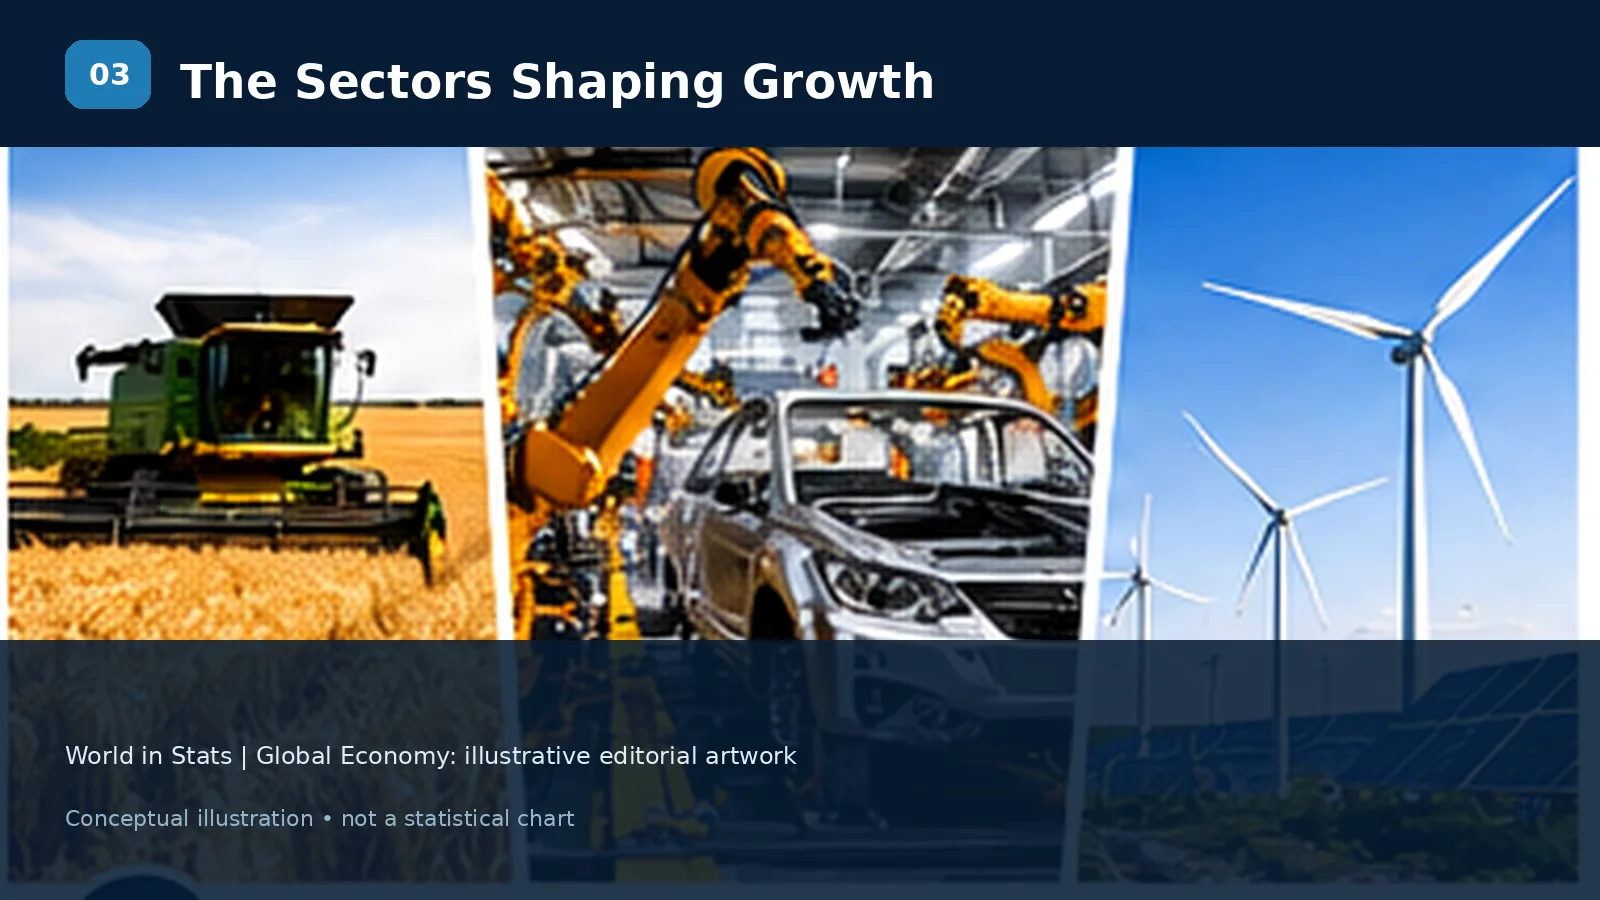
Agriculture, forestry and fishing support food supply, employment, trade and rural incomes. Their contribution to GDP may be relatively small in rich economies, but the sector can remain critical to price stability, livelihoods and resilience.
Water scarcity, fertiliser availability, energy costs, extreme weather, soil quality, storage infrastructure and trade policy shape agricultural outcomes. Precision agriculture and automation may improve efficiency, but adoption depends on farm size, financing, skills and digital infrastructure.
A common misconception is that a small share of GDP means an unimportant sector. Food supply disruptions can have outsized consequences for inflation and poverty. The World Bank defines agricultural value added as gross output minus intermediate inputs under its national-accounts framework. Sector value added must not be conflated with agricultural export revenue or employment. Source: World Bank WDI agricultural value added metadata.
5. Manufacturing and industry: not disappearing, but reorganising
Industry includes manufacturing, construction, mining and utilities in standard national-accounts classifications. Manufacturing encompasses everything from textiles and food processing to advanced machinery, pharmaceuticals and semiconductors.
Production is increasingly distributed across locations: design in one economy, specialised components in another, assembly elsewhere, and software and services added throughout. Industrial policies, energy costs, tariffs, subsidies and access to skilled workers influence decisions to build plants.
Semiconductors illustrate the complexity. Chip design, manufacturing equipment, materials, foundry capacity, packaging and downstream electronics rely on different specialist firms and countries. An economy can be strategically central to the chip ecosystem without producing every component domestically.
Automation complicates interpretation. Rising manufacturing output with flat or falling employment is not necessarily evidence of industrial collapse. Productivity, outsourcing, exchange rates, product mix and changes in national statistics all matter.
6. Services: the broad engine of modern economies
Services cover commerce, logistics, hospitality, healthcare, education, finance, technology and professional activities. Their share of GDP tends to be high in advanced economies, but this does not make all service jobs high-paying or all services easily exportable.
Digital delivery has expanded opportunities for software, design, research, remote professional work and some business services. Other activities—care, accommodation, food services and construction-adjacent local services—remain geographically rooted.
A misleading simplification is that manufacturing creates 'real' value but services do not. Both can generate value added. However, comparing sectors requires careful treatment of prices, intermediate inputs and productivity. Real productivity in certain services, especially public or nonmarket services, is difficult to measure.
The World Bank's WDI metadata provides standard categories for services value added and industry value added, which are appropriate starting points for country comparisons. Services metadata; Industry metadata.
7. Finance, housing and construction: the transmission channels
Credit availability, interest rates and confidence affect housing, investment and consumption. Higher policy rates tend to increase borrowing costs, but the impact depends on whether borrowers have fixed or variable rates, when loans are refinanced and the health of banks.
Construction and housing can create employment and raise the productive stock of buildings and infrastructure. Yet rapid property-price inflation without corresponding income growth may reduce affordability. A rising house price is not automatically an increase in society's productive capacity.
Financial-sector size must be assessed alongside stability, credit quality, household indebtedness, access to financing and regulatory institutions. Countries with identical headline GDP growth may have dramatically different exposure to property and banking shocks.
8. Technology and AI: investment boom versus realised productivity
AI is affecting the global economy through two distinct channels: first, investment in hardware, data centres, networks, electricity systems and software; second, potential changes in the productivity of businesses and workers using these tools.
The first channel is visible in capital expenditure and trade flows. The second is harder to quantify: a company buying GPUs is not proof that the wider economy has already achieved permanently higher productivity. The gains depend on implementation, complementary skills, organisational changes and the costs of deploying technology.
The IMF's October 2026 outlook identifies AI-related investment as a support for growth, while warning that excessive expectations or a repricing of AI-related assets could become a downside risk. Some economies gain immediately from manufacturing AI-enabling equipment; others face high electricity costs or lack infrastructure.
Key questions for future analysis include:
- Does AI investment increase measured output per hour, rather than only hardware expenditure?
- Are gains widespread among smaller firms or concentrated in large businesses?
- Do workers' real earnings improve along with output?
- Are electricity supply and grids adequate for new data centres?
- How much capital expenditure translates into sustainable cash flows?
Scenario, not prediction: widespread complementary adoption could lift productivity by 2030–2040; constrained power, limited diffusion or poor economics could reduce the payoff.
9. Energy and electricity: the physical foundation of digital growth
The energy transition is inseparable from industrial development. Factories, households, transport systems and data centres all require reliable energy, while price shocks influence inflation and economic output.
The IEA estimates that global electricity demand grew around 3% in 2025, compared with about 1.3% total energy demand growth. Data-centre electricity use grew roughly 17%, but this contributed approximately 70 TWh against a total global electricity-demand increase of around 800 TWh. This distinction is essential: a fast-growing sector is not necessarily responsible for most of the absolute increase. Source: IEA, Global Energy Review 2026.
On the supply side, the IEA reports that renewables accounted for 34% of global electricity generation in 2025, up from 32% in 2024. These figures concern electricity generation, not total primary energy or final energy consumption. Comparisons must not mix the denominators. Source: IEA electricity supply.
For economies seeking investment in advanced manufacturing and computing, grid capacity, electricity reliability, permitting and transmission can be as decisive as tax incentives.
10. Global trade: more resilient, but changing shape
International trade connects production networks, consumers and capital goods. Protectionist measures, conflict and shipping disruptions can increase costs; companies may adapt through alternative routes, multiple suppliers, regional integration and inventory buffers.
The WTO's October 2026 update projects 3.9% growth in world merchandise trade volume in 2026 and 4.1% in 2027, citing resilience in supply chains and strong demand for AI-enabling goods, although gains differ considerably across regions and between goods and services. These are projections and may change. Source: WTO, October 2026.
Trade volume is not the same as the dollar value of trade. Higher commodity prices can raise trade values even when quantities stagnate, while shifts in exchange rates can complicate comparisons.
The important question is not simply whether globalisation is ending. It is which products, countries and links in the value chain are becoming more or less integrated. Supply-chain diversification can coexist with continued growth in total global trade.
11. Who is driving growth? Economic size is not growth speed
A large economy can contribute substantial amounts to global output even when its percentage growth is modest. A smaller country can record rapid growth while contributing less to the absolute change in world GDP.
The United States remains central to global finance, high-value services and AI investment. China is a major manufacturing hub and technology investor, while facing structural adjustments including demographics and property-sector pressures. India has a large, relatively young population and opportunities for investment and service-sector expansion, but must create productive employment at scale. The euro area combines advanced industries and services with ageing and energy challenges. Japan has deep industrial and technology capabilities alongside long-term demographic pressures.
Southeast Asian economies differ substantially in income, manufacturing specialisation, institutions and exposure to trade. African economies likewise must not be treated as a single economic unit: population trends, commodity dependence, infrastructure, fiscal space and institutions vary enormously. Latin American economies have different exposures to commodities, domestic demand, investment and productivity.
Do not publish unsourced precise rankings of which region 'wins'. A meaningful comparison needs both GDP growth and shares of global output, measured on comparable bases, plus per-capita outcomes and uncertainty.
12. Population, ageing and migration change economic potential
Demography influences the supply of workers, demand for housing and public services, savings, pensions and healthcare. But population size alone does not determine prosperity: education, participation rates, capital investment and productivity also matter.
The UN's World Population Prospects 2024 projected that world population could peak at approximately 10.3 billion in the mid-2080s. This is a demographic projection, not an inevitable outcome. Source: United Nations.
Some countries confront ageing and shrinking working-age cohorts, while others must create jobs for rapidly growing numbers of young people. Migration can change labour supply and demand, but its economic effect depends on integration, skills, housing and institutions.
It is misleading to assume either that more people always cause faster growth or that ageing guarantees decline. Productivity and policy shape how demographic trends translate into economic results.
13. Jobs, wages and productivity: the human test of growth
The ILO's Employment and Social Trends 2026 projected 4.9% global unemployment in 2026. It also estimated that the broader global jobs gap would reach 408 million, reflecting people who want paid work but cannot access it. These are different measures. The ILO highlights persistent informality, poverty among employed people and unequal opportunities. Source: ILO, 2026.
A low unemployment rate can coexist with poor job quality if many workers are informally employed, underemployed or earning wages that fail to keep pace with living costs.
Economically meaningful progress should be examined through:
- Employment-to-population and labour-force participation rates.
- Real wages and real household income.
- Labour productivity and hours worked.
- Informality and job security.
- Differences by age, gender and education.
- Access to healthcare, housing and essential services.
The strongest growth story is not necessarily the country with the highest quarterly GDP number; it is the economy able to sustain productivity improvements that reach a broad share of households.
14. Inflation, interest rates and the cost of living
Inflation is the rate at which the general price level changes. A decline from 8% inflation to 3% inflation means prices are still rising, just more slowly. A broad price decline is deflation, which is different and can bring risks of its own.
Households experience inflation differently depending on their spending patterns. Energy, food and housing can have an outsized influence on perceptions of affordability. Nominal wage growth may look strong but still fail to improve purchasing power if consumer prices rise faster.
Central banks adjust monetary policy to pursue price stability and, in some economies, employment objectives. The effect of policy changes on investment and consumption occurs through credit, expectations, exchange rates and wealth, often with considerable lags.
In October 2026, global inflation and interest-rate dynamics cannot be understood without the energy shocks and geopolitical risk reflected in the IMF outlook. Country-specific monetary policy and inflation figures should not be generalised to the entire world.
15. Public debt, borrowing costs and economic resilience
Government debt is not analogous to the balance on a household credit card. Its sustainability depends on interest costs, maturity structure, currency denomination, expected economic growth, primary fiscal balances and investor confidence.
An economy with debt equal to 100% of annual GDP is not automatically insolvent; nor is one with a low debt ratio automatically safe. Higher refinancing costs, weak tax capacity or substantial foreign-currency borrowing can increase vulnerability.
Useful indicators include debt-to-GDP, interest payments relative to government revenue, the average maturity of debt, share held in foreign currency and projected primary balances.
The IMF stresses fiscal vulnerabilities and the importance of rebuilding buffers in its October 2026 assessment. Any country case study should use its own fiscal records rather than simply importing a global narrative.
16. Why GDP growth can coexist with falling living standards
GDP measures production; household welfare is a different outcome. A country can grow while median wages stagnate, rents climb, public services deteriorate or the benefits accrue to a narrow part of society.
To investigate that tension, compare real GDP per capita with real median earnings or household disposable income, housing affordability, poverty rates and distribution indicators. Use consistent periods and explain gaps in coverage.
A simple hypothetical example illustrates the problem: if real GDP grows 3% while population grows 2%, real output per person increases by only approximately 0.98% ((1.03 / 1.02) − 1), before accounting for distribution. GDP per person can still rise while the median household's financial circumstances deteriorate.
Cause and correlation are different. An observed gap between GDP and wages does not on its own establish whether housing supply, bargaining power, labour-market composition, productivity or tax policy caused it.
17. Climate, resources and shocks to the economic system
Extreme weather, water stress, agricultural disruption and damage to infrastructure impose economic costs. Policies for decarbonisation can require near-term investment while affecting long-run energy security and exposure to climate risks.
Countries differ in their vulnerability, resilience and capacity to finance adaptation. Fossil-fuel exporters and importers also respond differently to commodity-price shocks, so there is no single economic effect shared by every region.
A careful analysis separates physical climate risks, transition risks, opportunities for productive investment and uncertain long-horizon projections. Expenditure on rebuilding after a disaster can temporarily increase measured GDP even when the disaster reduced wealth and wellbeing: another reason GDP alone cannot tell the whole story.
18. What could 2030–2040 look like? Three conditional scenarios
No responsible analysis can assign a precise, guaranteed level of world GDP in 2040 from today's headlines. Instead, consider how a few key drivers might combine.
| Scenario | Main assumptions | Potential economic pattern | What would challenge it |
|---|---|---|---|
| Productivity diffusion | AI and automation spread beyond leading firms; grids and skills expand; trade remains workable | Broader productivity and real-income gains | Weak adoption, grid bottlenecks, financial overinvestment |
| Uneven continuity | Technology advances but benefits remain concentrated; trade adjusts gradually; ageing persists | Positive yet unequal growth with persistent regional gaps | Significant productivity acceleration or major shock |
| Fragmented, shock-prone world | Recurrent conflict, persistent energy disruptions, fiscal stress and trade restrictions | Slower investment and wider divergence between countries | Diplomatic improvements, diversification, stronger institutions |
These are qualitative scenarios created for this article, not IMF, World Bank or IEA quantitative forecasts. No fabricated probabilities or precise growth figures are assigned. They are a framework for thinking about conditional futures.
The variables to track annually include productivity growth, private investment, electricity-grid expansion, trade composition, real household income, fiscal capacity and demographics.
19. A guide to the charts this report should eventually contain
The final article should support its conclusions with original World in Stats visualisations. Proposed charts should be researched and validated before publishing:
- Global real GDP growth, 1990–2027: observed historical data followed by clearly shaded IMF projections; show source vintage and methodology.
- Sector composition across economies: agriculture, industry and services value added as shares of GDP for a consistent set of countries and years. Do not confuse sector value added with employment shares.
- The world economy by region: real output growth and shares of global GDP on explicitly defined market-exchange-rate and PPP bases.
- Prices versus inflation: a hypothetical indexed price-level series showing why declining inflation need not imply falling prices.
- Electricity demand and AI infrastructure: IEA observed 2025 electricity-demand changes, contrasting absolute TWh contributions with percentage growth rates.
- Employment beyond unemployment: ILO global unemployment and jobs-gap series with independent, clearly labelled units.
- Trade volumes and AI-enabling goods: WTO projections distinguished from observed trade outcomes.
- Living standards: a country-level comparison of real GDP per capita and a suitable household income series, showing any data gaps.
Avoid generating plots from invented yearly values. The source dataset, transformation code, currency and units should be preserved for reproducibility.
20. Methodology: what these numbers can and cannot establish
Cutoff: economic assessment as of 18 October 2026, using the then-current source releases cited below. The IMF October 2026 outlook states that its projections draw on information available through 1 October 2026. Other source vintages differ.
Status: figures labelled 2026 or 2027 are forecasts or modeled estimates unless explicitly described as observed data. Sector definitions come from World Bank WDI national-accounts metadata; years and sector categories must be checked before cross-country chart production.
Aggregation: IMF, World Bank, WTO, ILO and IEA track different concepts, use different weighting schemes and update at different times. Their headline figures should never be combined in an unlabeled composite average.
Limitations: national statistics can be revised; coverage varies between countries; GDP measures production rather than welfare; dollar-denominated comparisons can change with exchange rates; historical sector data may contain classification breaks; AI productivity effects are uncertain.
Editorial standard: prefer primary institutions, cite a claim near the relevant paragraph, distinguish data from interpretation and refrain from assigning certainty to forecasts. Any later chart or illustration must be checked independently for accurate numbers and rights.
Conclusion: the defining question is who benefits from growth
The economic story of 2026 is not simply that the world is growing by around 3%. It is who generates that growth, which resources make it possible, and whether productivity gains translate into broad improvements in living standards.
Industry and services remain intertwined. AI investment can raise hardware demand without automatically delivering society-wide productivity. More electricity is required, but energy transitions differ by country. International trade remains resilient in aggregate while supply chains reconfigure. Labour-market stability can conceal problems of job quality.
For the coming decades, the most revealing measures will be those that connect macroeconomic expansion to productive capacity, household outcomes and resilience to shocks.
World in Stats editorial analysis. This is explanatory research, not investment advice. Forecasts and scenarios are inherently uncertain and subject to revision.
Sources & references
- IMF — World Economic Outlook, October 2026: Resilience Under Strain, Urgent Choices
- World Bank — Global Economic Prospects
- WTO — Global Trade Outlook and Statistics, October 2026
- ILO — Employment and Social Trends 2026
- IEA — Global Energy Review 2026: Electricity Demand
- IEA — Global Energy Review 2026: Electricity Supply
- World Bank — WDI: Agriculture Value Added, Metadata
- World Bank — WDI: Industry Value Added, Metadata
- World Bank — WDI: Services Value Added, Metadata
- UN — World Population Prospects 2024: Population Peak Outlook
Found an error? Contact us with the source and passage to correct.