Global Economy
Global Oil Reserves: Which Countries Control the World's Oil?
A data-led explanation of where crude reserves are concentrated, why production differs and how oil-market influence works.
Key takeaways
- Proven crude oil reserves are concentrated in the Middle East, but reserves are not production or exports.
- Oil sands create major comparability differences between reserve datasets.
- Technology, infrastructure and costs determine whether reserves can be commercialised.
- IEA and OPEC forecasts differ substantially because their scenarios use different assumptions.
Reading the numbers: This article uses the Organization of the Petroleum Exporting Countries (OPEC) Annual Statistical Bulletin 2026 definition of proven crude oil reserves for its main statistical comparison. That definition excludes Canada's oil sands. Other definitions produce different country rankings; figures from those series should not be added to this one.
The short answer
Venezuela reports the largest proven crude oil reserves among OPEC members, at approximately 303.70 billion barrels at the end of 2025. Saudi Arabia follows with 267.20 billion barrels and Iran with 208.60 billion barrels. OPEC's global series totals 1,572.46 billion barrels of proven crude oil reserves, of which the Middle East accounts for 873.05 billion barrels (55.52%). OPEC members collectively account for 79.08% of the global total in that statistical series. OPEC: world reserves · OPEC: member reserves
But reserves are not the same as oil-market control. A large reported underground stock does not automatically translate into high daily production, large exports or an ability to respond quickly to a supply interruption. The United States produced more crude oil than any other country in 2025, averaging 13.6 million barrels per day, including lease condensate, according to the U.S. Energy Information Administration (EIA). EIA, 9 July 2026
The distinction between oil underground and oil deliverable to market is the central issue in energy security.
1. What counts as an oil reserve?
An oil reserve is not the total amount of petroleum thought to exist beneath the ground. In petroleum-resources classification, proved reserves refer to quantities expected to be commercially recoverable from known accumulations under specified technical, economic and development conditions. Estimates depend on data, assumptions and reporting standards; they are not direct physical measurements of every barrel.
Three concepts must be kept separate:
- Oil in place: an estimate of petroleum present in a formation, much of which may never be extracted.
- Technically recoverable resources: petroleum that may be recoverable with existing technology, regardless of whether recovery is profitable.
- Commercially recoverable reserves: a narrower category that depends on economics, engineering, infrastructure and approved development arrangements.
This explains why reported reserves can change even without a major new discovery. Technology, prices, field development and reporting revisions can all influence the estimate. Reporting practices and independent assurance also differ across countries. Very precise national totals should therefore not be read as equally precise geological facts.
Why Canada changes the ranking
The distinction is particularly important for Canada. The EIA reported 163 billion barrels of proved Canadian oil reserves as of January 2024, with 97% associated with oil sands. That is a broader category and a different reference date from the OPEC year-end 2025 crude-only dataset. EIA Canada country analysis
A frequently circulated global reserves ranking may therefore place Canada close to the very top, while a table built from OPEC's narrower series does not. Neither ranking is automatically wrong: they answer differently defined questions. A valid cross-country comparison must use one consistently defined and dated source, or explicitly rebuild and document the combined series.
2. Where are proven crude oil reserves concentrated?
The OPEC Annual Statistical Bulletin 2026 reports the following world statistical groupings for year-end 2025. These are OPEC-defined groups, not a uniform list of continents: for example, Russia, China and India appear separately.
| OPEC statistical grouping | Billion barrels | Share of OPEC-defined world total |
|---|---|---|
| Middle East | 873.05 | 55.52% |
| Latin America | 346.30 | 22.02% |
| Africa | 119.09 | 7.57% |
| Russia | 80.00 | 5.09% |
| OECD Americas | 52.28 | 3.32% |
| Other Eurasia | 38.87 | 2.47% |
| China | 34.47 | 2.19% |
| Other Asia | 11.42 | 0.73% |
| OECD Europe | 9.18 | 0.58% |
| India | 5.00 | 0.32% |
| OECD Asia Pacific | 1.88 | 0.12% |
| Other Europe | 0.91 | 0.06% |
| World | 1,572.46 | 100.00% |
Source: OPEC ASB 2026, World proven crude oil reserves. Shares are calculated from the source's displayed values and rounded to two decimal places. Individually rounded entries and percentages may not sum precisely to the total.
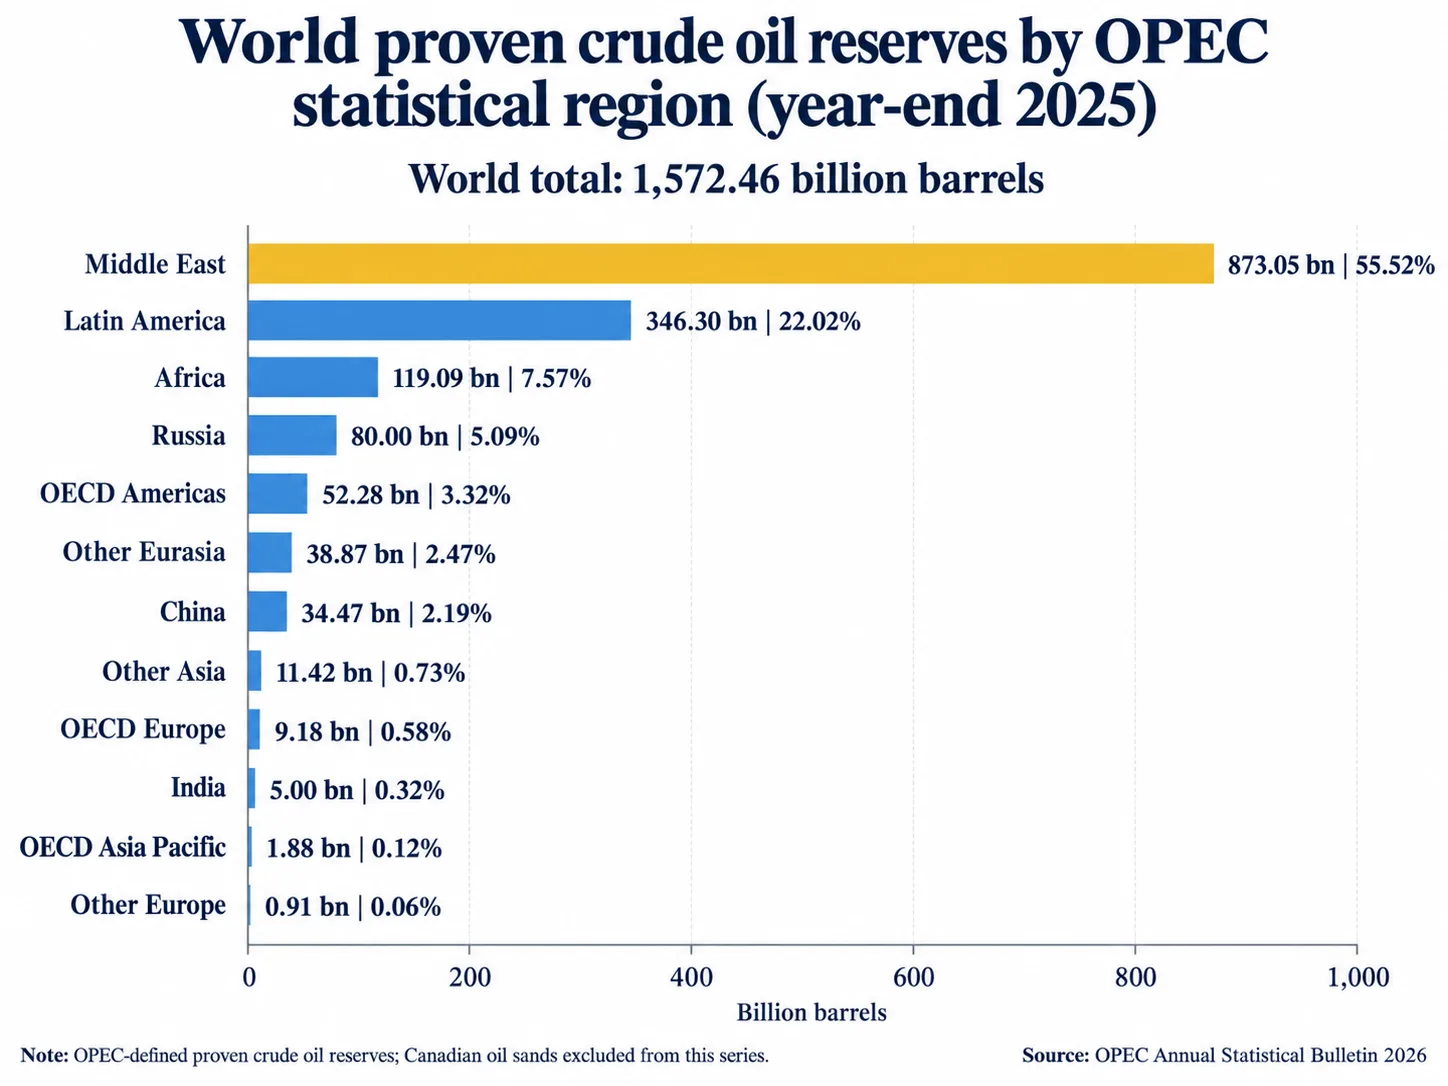
The Middle East and Latin America together account for approximately 77.54% of the reserves in this definition. This is an extraordinary concentration of reported reserves, but it says less about the distribution of today's oil supply than it first appears. Recoverability, investment, domestic use and commercial access matter just as much.
Major reserve holders: a verified OPEC-member comparison
The following is not presented as a complete global ranking. It lists the largest reserve holders among OPEC member countries and is directly supported by OPEC's 2026 member-country table. Figures have been rounded to two decimals to match the source display.
| Position among OPEC members | Country | Proven crude reserves, billion barrels |
|---|---|---|
| 1 | Venezuela | 303.70 |
| 2 | Saudi Arabia | 267.20 |
| 3 | Iran | 208.60 |
| 4 | Iraq | 140.00 |
| 5 | United Arab Emirates | 120.00 |
| 6 | Kuwait | 101.50 |
| 7 | Libya | 48.36 |
| 8 | Nigeria | 37.01 |
Source: OPEC ASB 2026, OPEC members' proven crude oil reserves, end-2025. The table deliberately excludes non-members rather than implying that their country-level figures have been checked to an equivalent standard.
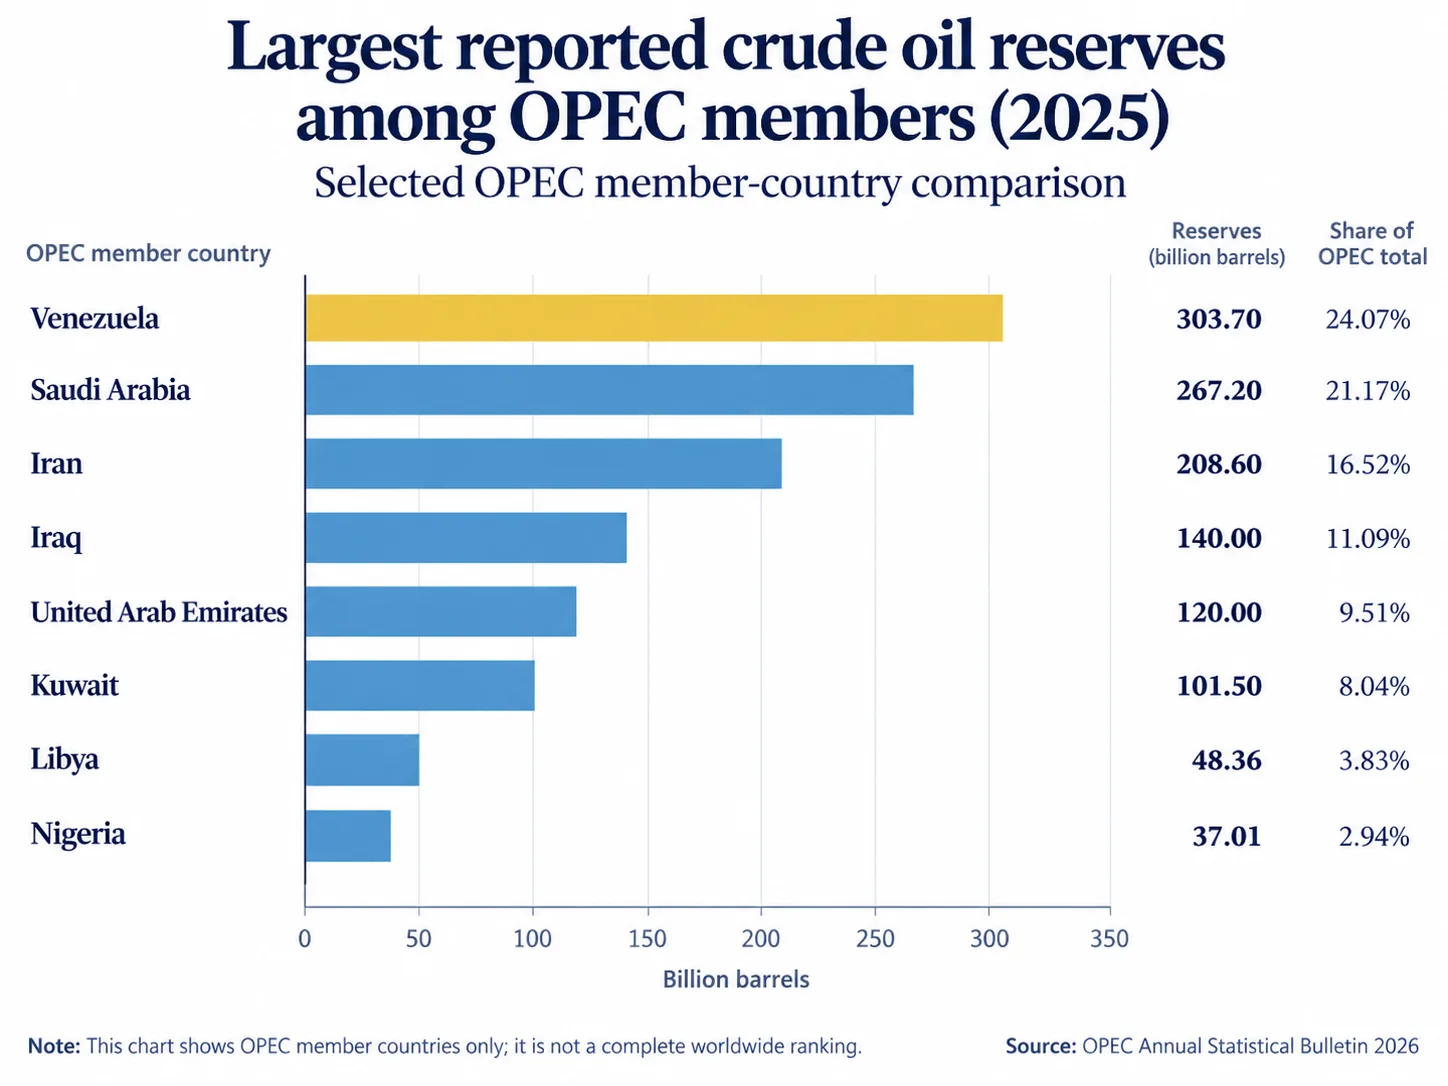
The top five countries in this OPEC-member selection account for approximately 66.1% of the OPEC-defined global reserves total. That concentration creates long-term strategic importance, but not a uniform ability to expand production at short notice.
3. Why the reserve leader is not the production leader
Venezuela illustrates the distance between geological potential and market supply. Much of its reported resource base is associated with the Orinoco Belt's extra-heavy oil. Extracting, blending, upgrading, processing and transporting these grades requires equipment, diluents, electricity, investment and dependable infrastructure. Financial and trade restrictions can further affect market access.
Saudi Arabia combines large reserves with established producing fields and extensive export infrastructure. Its role within OPEC+ also means actual output can be influenced by deliberate production policy. Installed or sustainable capacity, actual production, and spare capacity are different measures and must not be conflated.
Iran and Iraq hold major reported reserves, but their investment, infrastructure, financing and political conditions differ. Russia combines established production infrastructure with exposure to sanctions, shipping and commercial restrictions. Canada demonstrates how technology can unlock unconventional resources, although oil-sands projects have distinctive capital, environmental and processing requirements.
The United States offers the clearest counterexample to the idea that the largest reserves produce the most oil. Horizontal drilling, hydraulic fracturing and shale-field operational improvements have supported extremely high crude output. These fields also require continuing investment because many individual tight-oil wells decline relatively quickly after their early production period.
A source-consistent 2025 production comparison
| Country | Crude oil production, 2025 average |
|---|---|
| United States | 13.6 million barrels/day |
| Russia | Approximately 9.9 million barrels/day |
| Saudi Arabia | Approximately 9.6 million barrels/day |
Source: EIA, 9 July 2026. The measure is crude oil including lease condensate, not all petroleum liquids. The EIA identifies the United States as the largest producer.
Key insight: Reserves are a stock accumulated in a geological estimate. Production is a flow generated each day by operating assets. Neither measure alone determines petroleum export volumes or price influence.
4. Who influences the world oil market?
The word control is tempting but imprecise. Oil-market influence comes from several different capabilities:
| Measure | What it tells us | What it does not tell us |
|---|---|---|
| Proven reserves | Estimated commercially recoverable stock | How fast it can be produced |
| Production | Barrels extracted over a period | How much is available for export |
| Spare production capacity | Potential additional supply under specified conditions | How long it can be maintained without constraints |
| Crude exports | Crude sold across borders | Total production or refined-product exports |
| Refining | Ability to transform crude into usable products | Domestic ownership of underground reserves |
| Consumption | Size and structure of domestic petroleum use | Ability to increase oil supply |
| Shipping and storage | Ability to move and buffer supplies | Geological resource ownership |
The United States, China and India demonstrate why demand, refineries and trade relationships matter. A large importer can influence trade patterns through its buying and refining decisions, even when it has limited domestic reserves. Conversely, an exporter with a large reserve stock can lose influence if transport infrastructure becomes unavailable.
Crude quality also matters. Refineries are designed for particular ranges of crude composition. Heavy, sour crude cannot always replace light, sweet crude without changes in refinery economics or configuration.
5. OPEC+, chokepoints and oil supply security
OPEC and cooperating non-OPEC producers can influence market balances through production decisions. But they do not independently dictate a single global oil price. Demand, inventories, spare capacity, alternative supply, financial conditions and expectations all contribute.
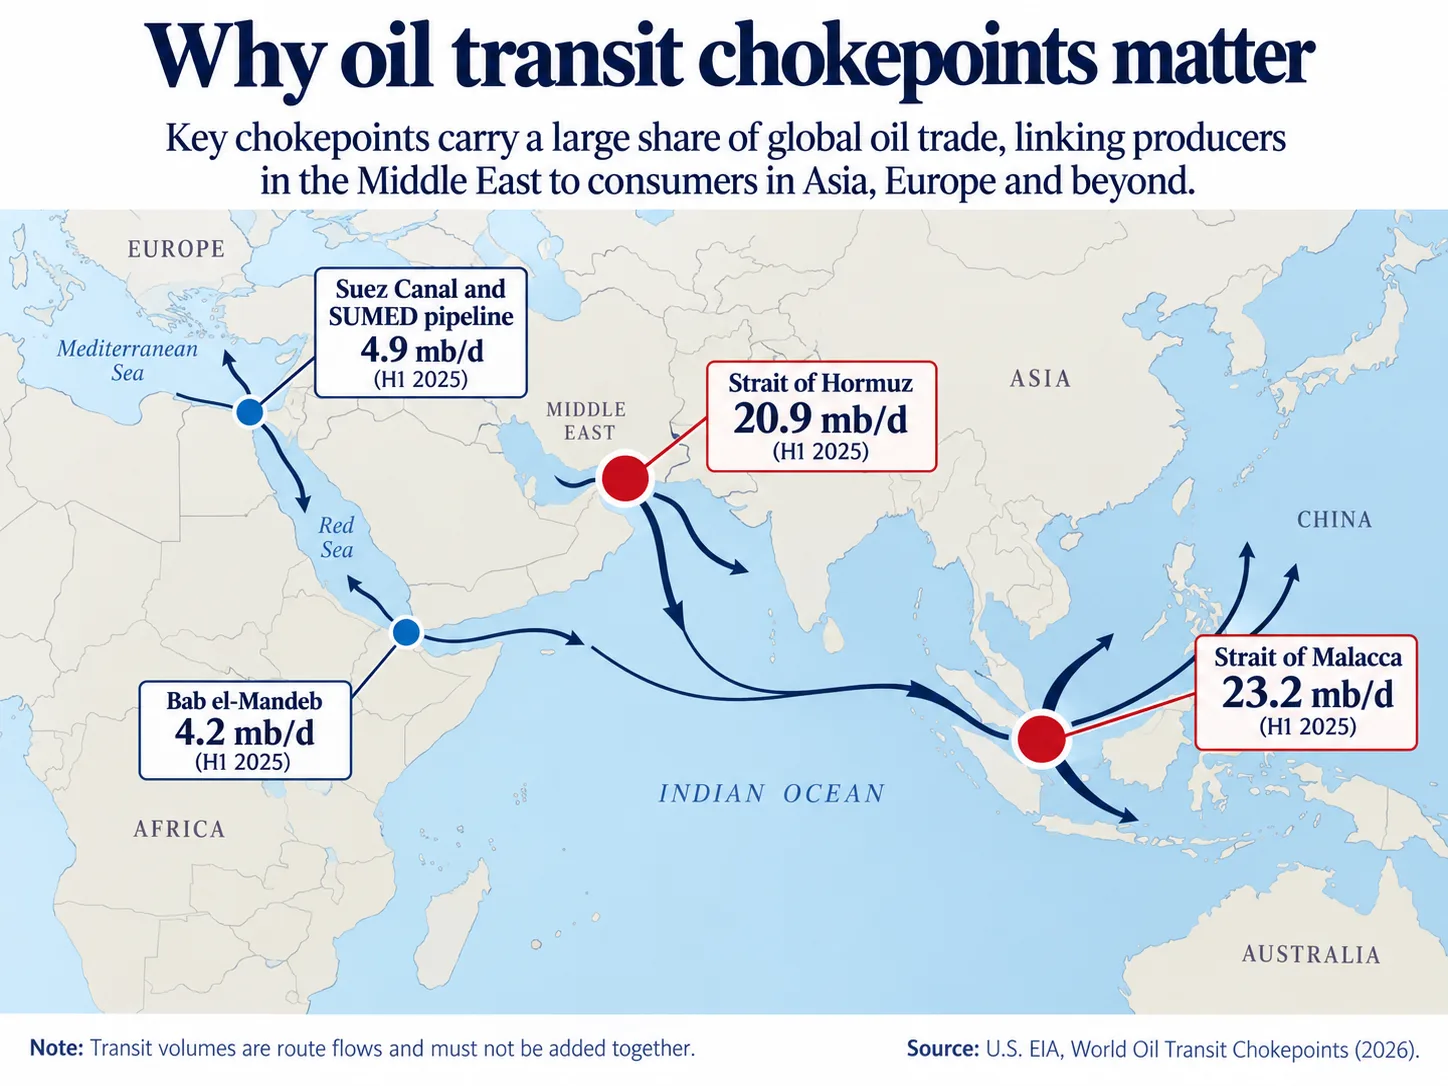
Oil also depends on a small number of highly consequential shipping routes. EIA reporting provides a useful historical benchmark for the first half of 2025:
| Route | H1 2025 oil and petroleum-liquids flow, million barrels/day |
|---|---|
| Strait of Malacca | 23.2 |
| Strait of Hormuz | 20.9 |
| Suez Canal and SUMED pipeline | 4.9 |
| Bab el-Mandeb | 4.2 |
Source: EIA, World Oil Transit Chokepoints. These are route-specific flows, not separate volumes that can be added together: the same cargo may traverse multiple chokepoints.
A later EIA publication shows why using dates is essential. Its August 2026 Global Energy Security Data release reports these quarterly averages:
| Maritime route | Q1 2026 | Q2 2026 | Unit |
|---|---|---|---|
| Strait of Hormuz | 14.9 | 4.9 | million barrels/day |
| Strait of Malacca | 21.3 | 16.6 | million barrels/day |
Source: EIA Global Energy Security Data, released 12 August 2026. These are historical quarterly flow estimates, not live shipping conditions on 18 October 2026.
The point is not that a reduction in one quarter must persist. It is that extraction capacity and geological reserves are of limited immediate use when shipping, insurance, infrastructure or market access are disrupted. Countries importing energy can face higher costs and greater supply uncertainty without any meaningful change in the world's reported reserves.
6. How much is an underground barrel worth?
One billion barrels of reserves in two countries do not necessarily have comparable economic value. The market value depends on the crude grade, recovery rates, capital investment, operating costs, transport, taxes, commercial access and the price available when oil is sold.
Cost comparisons require particular care:
- Lifting cost generally refers to operating expenses associated with producing oil from an existing asset.
- Full-cycle project breakeven seeks to capture the price needed to cover development, production and other costs while achieving a specified economic return.
- Government fiscal breakeven estimates an oil price compatible with a government's budget assumptions; it is not the operating break-even of its oil fields.
A commercially successful field can coexist with a government budget deficit. Likewise, a country may hold substantial reported reserves but lack capital, technical expertise or the institutions necessary to convert them into broad economic benefits.
Long-run uncertainty is especially important for undeveloped, expensive projects. If oil demand weakens faster than expected, some resources may never be commercially produced. If demand remains strong while investment falls short, available supply could become tighter. Neither outcome can be inferred from the reserve total alone.
7. Will oil demand peak before 2050?
The future of oil demand is contested. A transition toward electric vehicles and more efficient energy systems may reduce consumption of some transport fuels, while aviation, petrochemicals, industrial demand and economic growth could sustain other uses. The outcome depends on policy, technology, adoption rates and energy prices.
Three major institutions' published outlooks highlight the uncertainty:
| Source and scenario | Time horizon | Published outlook |
|---|---|---|
| IEA, Oil 2025 | Around 2030 | Global demand approaches a plateau near 105.5 million barrels/day |
| IEA, World Energy Outlook 2025, Stated Policies Scenario | Around 2030 | Global oil demand peaks near 102 million barrels/day |
| IEA, World Energy Outlook 2025, Current Policies Scenario | 2050 | Demand reaches 113 million barrels/day |
| OPEC, World Oil Outlook 2026 | 2050 | Demand reaches approximately 124 million barrels/day |
Sources: IEA Oil 2025; IEA WEO 2025 — Stated Policies; IEA WEO 2025 — Current Policies; OPEC World Oil Outlook 2026 announcement. These are distinct models, scenarios, report vintages and potentially different oil-product coverage. They must not be plotted as if they were points in one consistent time series.
A peak in oil demand would not mean the immediate end of oil consumption. It would mean that total demand ceases to rise and may subsequently decline. The economic implications would depend on how production, investment and spare capacity adjust.
Three possible pathways, not predictions
Prolonged demand growth. Transport and industrial growth, especially in emerging economies, support continued large-scale oil consumption. Investment and shipping security remain central.
Gradual transition. Demand plateaus and then declines unevenly across regions and products. Producers with lower costs and reliable market access have an advantage, while oil-dependent governments face greater pressure to diversify.
Faster transition. Stronger electrification, efficiency improvements and substitution reduce petroleum demand more quickly. Higher-cost undeveloped deposits become more exposed to the risk of never being developed.
These are conditional analytical interpretations, not estimates of probability, price targets or independent numerical forecasts.
8. What does this mean for the world economy?
The oil market connects resource geography with technology, geopolitics, transport and industrial demand. High-reserve countries may have enormous long-run options, but converting those options into revenue requires financing, governance, export infrastructure and customers. High-production countries can lead global flows without leading reserve tables. Major refining and importing economies help determine where crude goes and which grades command a premium.
Oil-importing households and businesses ultimately care about access to reliable supplies and product prices—not just how many barrels remain underground. Oil-exporting states must weigh near-term revenues against the long-run risks of concentrated public finances. Investors must distinguish between reserves, producible assets and projects likely to earn an adequate return after costs.
The essential conclusion: No country controls the world's oil solely by reporting the largest reserves. Geological endowment matters, but market influence rests on a changing system of production, spare capacity, refining, trade routes, costs, institutions and demand.
Methodology and sources
Statistical vintage. Reserve figures use end-2025 observations in OPEC's 2026 statistical bulletin. Production figures refer to average daily 2025 crude output including lease condensate in the EIA's July 2026 analysis. Shipping tables refer to their explicitly named historical periods. Demand figures are forecasts or scenario endpoints, not observations.
Definitions. Reserve figures are OPEC-defined proven crude oil reserves. The Canada example deliberately uses an EIA figure outside that definition to explain why apparently conflicting lists cannot be merged. OPEC's regions are statistical groups, not continents. No unsupported world-wide country top-12 ranking is asserted.
Units and calculations. Reserve stocks appear in billion barrels; daily flows in million barrels per day. Regional and country percentages are calculated against OPEC's reported 1,572.46 billion-barrel world total; displayed numbers are rounded. Maritime routes may overlap and are not additive.
Sources. Primary statistical references include OPEC regional crude reserves, OPEC member-country crude reserves, EIA 2025 crude production, EIA Canada analysis, EIA maritime chokepoints, EIA 2026 energy security data, IEA Oil 2025, IEA World Energy Outlook 2025 and OPEC World Oil Outlook 2026.
Limitations. National reserve estimates are reported under differing systems. This article does not supply a fully reconciled global national reserve ranking, a top-ten production and exporter comparison, independently audited country-by-country production costs or a live assessment of shipping conditions. The latest cited observations are not a real-time feed. These omissions are preferable to a falsely precise comparison.
Sources & references
Found an error? Contact us with the source and passage to correct.