Investing Guides
Individual Stocks vs ETFs: Which Is Better for Long-Term Investors?
What decades of evidence show about diversification, returns, expenses, risk and choosing individual companies.

Key takeaways
- A diversified, low-cost index ETF is a defensible equity starting point for many long-term investors, but not all ETFs are diversified.
- Research on individual-stock returns documents extreme concentration of net wealth creation; it does not show that nearly all stocks lose money.
- SPIVA measures active fund managers, not individual retail stock-picking success; long-horizon results require consistent category definitions.
- Fees, behaviour and portfolio concentration affect realised outcomes, and neither investing approach eliminates stock-market risk.
- A core-satellite strategy can combine diversified ETFs and chosen shares, but it is not proven to outperform.
Executive summary
Investors deciding between individual shares and exchange-traded funds (ETFs) are making several decisions at once: how to obtain exposure to companies, how much company-specific risk to bear, how much research to undertake and how to keep costs and behaviour under control. These choices are not reducible to a contest over which asset had the highest return last year.
For most investors who want long-term exposure to share markets without researching businesses professionally, a broadly diversified, low-cost index-tracking ETF is the more defensible default. That conclusion does not guarantee a positive investment outcome or imply that every ETF is diversified. It follows from the benefits of diversified exposure, predictable fund-level costs, and the difficulty of identifying the relatively small set of companies that ultimately generate a disproportionate share of long-run returns. Individual stocks can be a reasonable choice for knowledgeable investors who accept concentrated outcomes; combining a diversified core with a limited stock-selection allocation can offer a compromise.
Several observations anchor this article. In a peer-reviewed study covering more than 64,000 global common stocks from January 1990 to December 2020, Bessembinder and co-authors found that 55.2% of US stocks and 57.4% of non-US stocks underperformed one-month US Treasury bills on a compounded-return basis. The top 2.4% of firms accounted for all US$75.7 trillion of net global stock-market wealth creation in their analysis. This does not mean all the remaining companies lost money. [1]
According to S&P Dow Jones Indices, 79% of actively managed US large-cap equity funds underperformed the S&P 500 in calendar 2025. SPIVA Europe separately found that 71% of euro-denominated global-equity active funds underperformed their designated benchmark in 2025. These statistics describe populations of active funds, not a directly measured success rate for households selecting individual stocks. [2][3]
In Morningstar's Mind the Gap US 2026, the average dollar invested in the studied US open-end mutual funds and ETFs earned 8.7% annually over the ten years ended 2025, while the funds' aggregate annual total return was 9.9%. The 1.2-percentage-point annual gap reflected the timing and magnitude of investor flows; it should not be interpreted as the difference between ETFs and individual stocks. [4]
Bottom line: broadly diversified index ETFs are a sensible starting position for many long-horizon equity investors; direct share ownership is a higher-effort choice offering more control and more stock-specific uncertainty. Investors facing near-term spending needs or limited ability to tolerate losses may need assets other than equities, regardless of whether shares are owned directly or through ETFs.
1. What are investors actually comparing?
An individual stock represents an ownership interest in a company. Its results depend on the company's financial performance, valuation, financing, competition, management, regulatory environment and, often, the broader economy. Shareholders may receive dividends, but distributions are not guaranteed. A company can grow while its share price falls if the original purchase price assumed even stronger growth.
An ETF is a pooled investment fund whose shares can generally be bought and sold on a stock exchange. Its investment exposures depend on its prospectus and portfolio. An index-tracking ETF may aim to follow a broad equity benchmark such as the MSCI ACWI. Other ETFs focus on a sector, a narrow theme, bonds, commodities or leveraged strategies. Some are actively managed; others track rules-based indices. ETFs are therefore a wrapper, not a separate asset class or a synonym for safety.
A broad market-capitalisation-weighted ETF allows an investor to hold many companies through one fund. An individual-stock investor chooses the companies and their position sizes directly. ETF investors relinquish some discretion over the specific shares and weights they own, but gain simpler access to diversified exposures and an automatically maintained index portfolio.
| Dimension | Individual company shares | Broad, index-tracking equity ETF |
|---|---|---|
| Underlying exposure | Selected company or companies | Many constituent companies defined by index rules |
| Company-specific risk | Potentially high | Usually reduced, not eliminated |
| Systematic equity-market risk | Still present | Still present |
| Flexibility | Direct control over each security | Fund/index determines constituent selection |
| Ongoing fund fee | None for directly held shares | Ongoing fund charge and tracking differences |
| Trading costs | Potentially one trade per holding | Usually fewer trades, but spreads/FX still apply |
| Tax and dividends | Depends on company domicile and investor jurisdiction | Depends on fund domicile, structure, distributing/accumulating class and jurisdiction |
| Research | Potentially substantial | Focus shifts to exposure, costs, suitability and asset allocation |
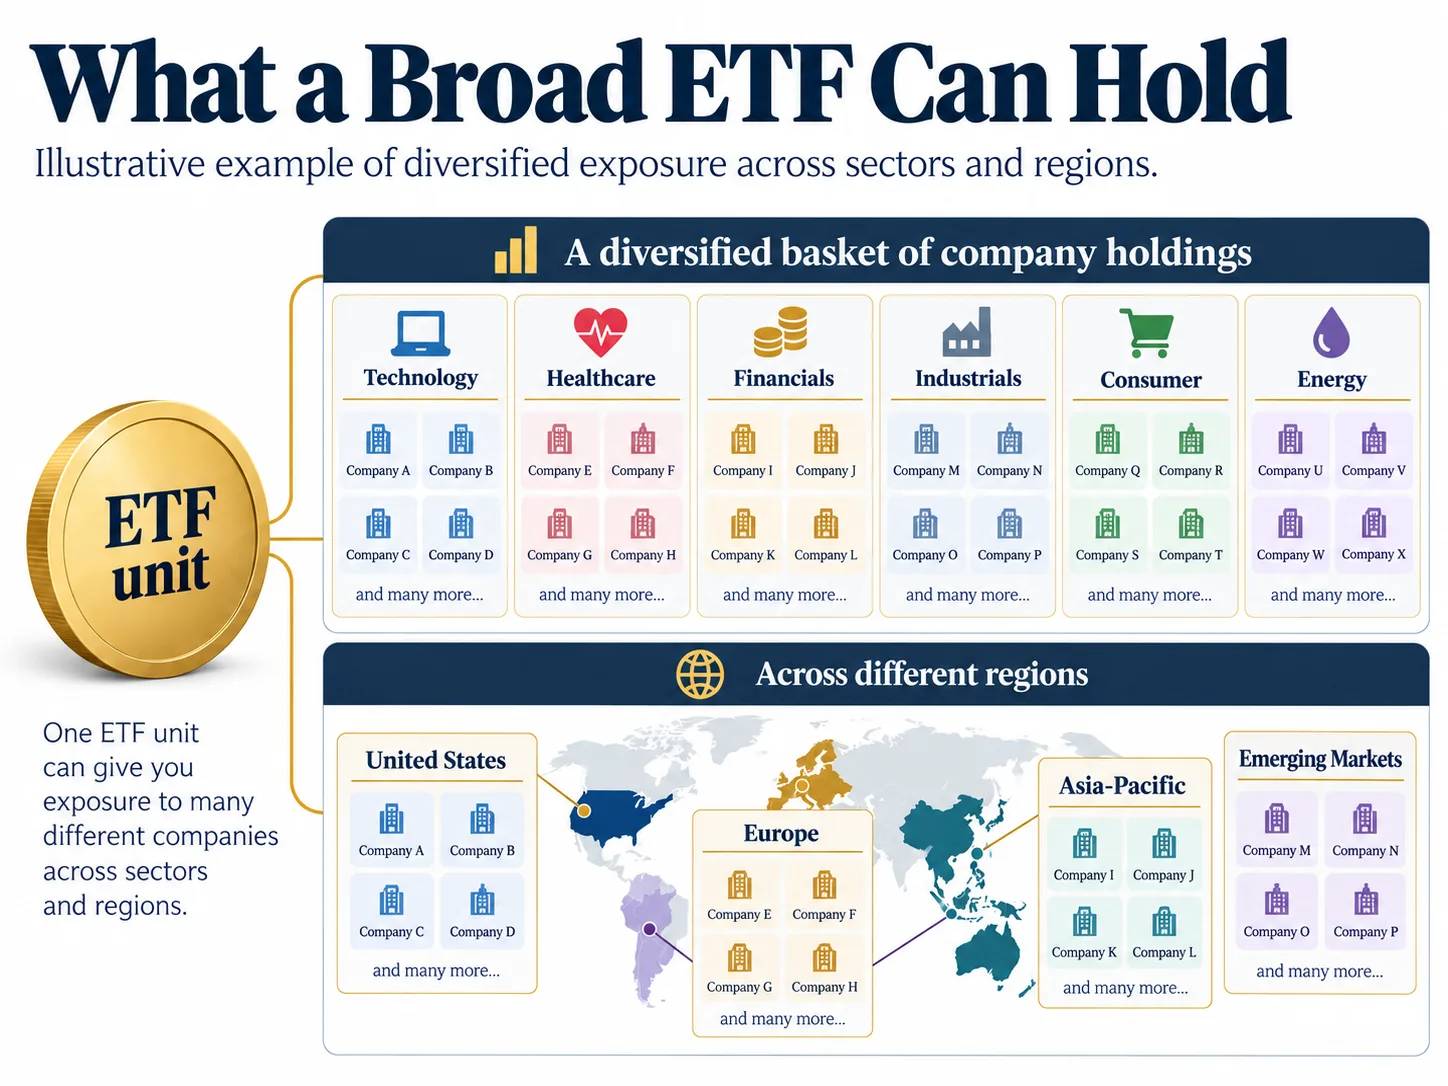
An accumulating share class generally retains and reinvests income inside the fund, while a distributing share class pays qualifying distributions. This distinction can affect administration and taxation, but neither structure makes the underlying investment risk disappear. Physical replication and synthetic replication also have different operational and counterparty arrangements: readers should examine fund documents rather than treating either label as a guarantee of superior performance.
2. The principle of diversification — and its limits
A company may encounter problems that do not strike the wider market: unsuccessful products, accounting failures, litigation, excessive borrowing or rapid technological displacement. Diversification reduces dependence on any single company's fortunes. Financial economists distinguish this idiosyncratic or company-specific risk from systematic risk affecting the broader market, such as recessions and changes in interest rates.
The number of shares in a portfolio matters, but it is not the whole story. Twenty businesses with nearly identical revenue drivers and correlated share-price movements can be less diversified than a smaller set spanning different industries. An ETF holding hundreds of companies may nevertheless be concentrated if several mega-cap names dominate its weight or if it exclusively tracks one industry or geography.
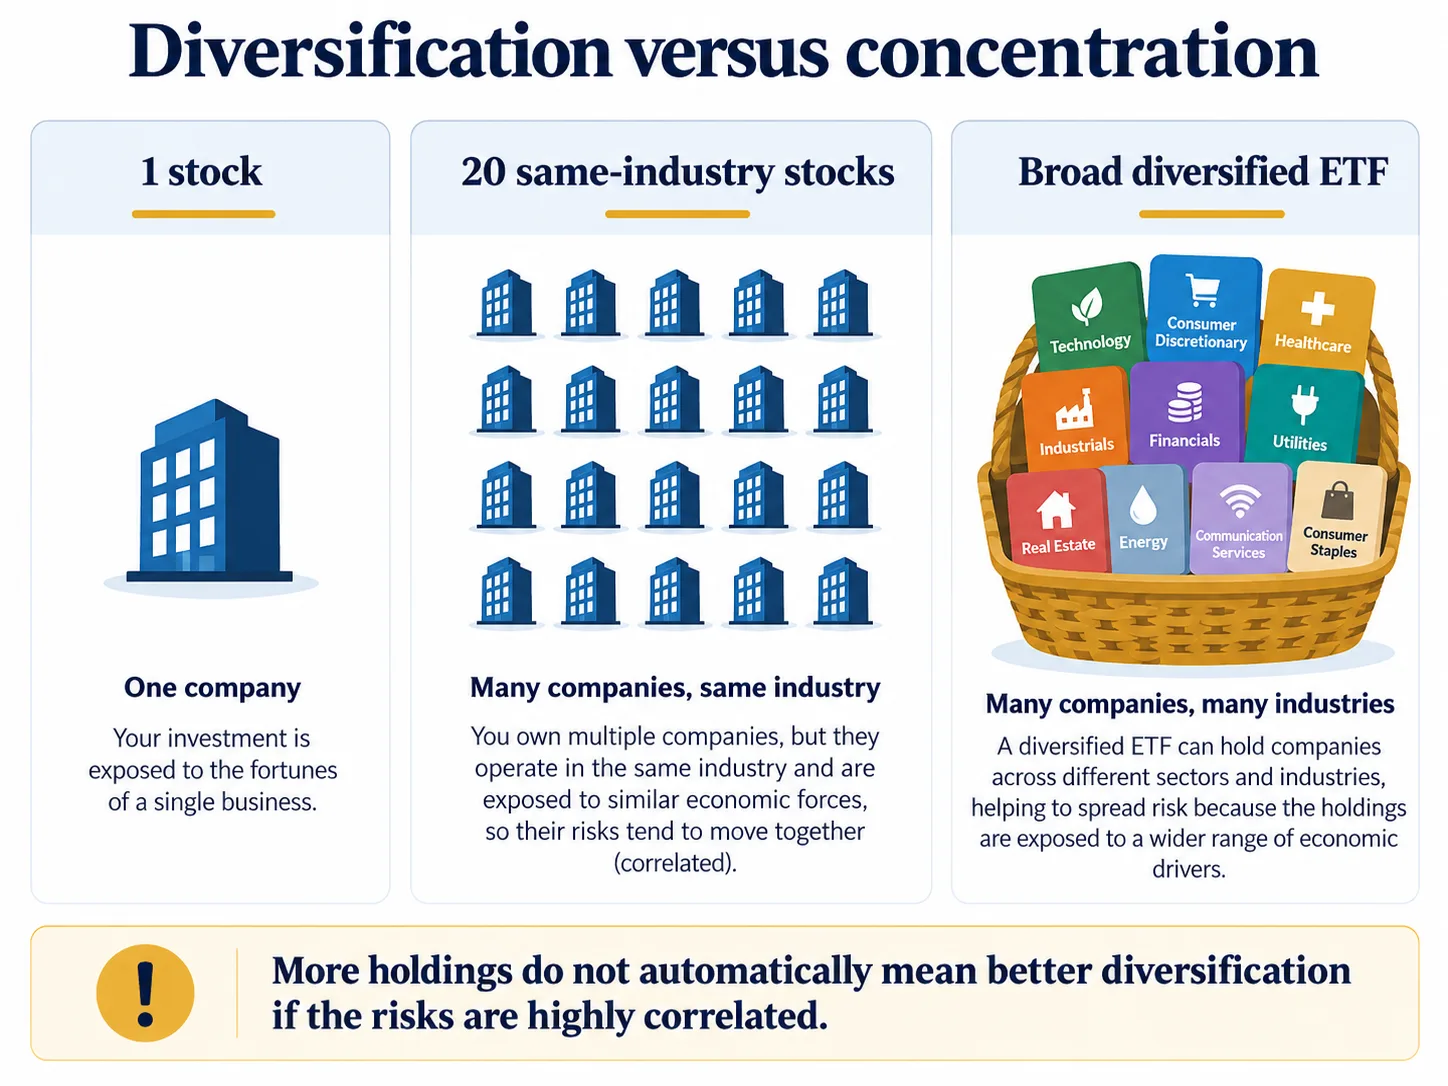
Market capitalisation weighting has a specific consequence: as a company rises in market value relative to others, it can become a larger part of the index. Investors participate in corporate winners without having to identify all of them in advance, but they may also become increasingly dependent on a handful of high-valued companies. A global equity benchmark spreads geographical exposure more widely than a US-only benchmark, yet may still allocate heavily to the United States.
Diversification cannot prevent broad equity bear markets, guarantee that a given ten-year period produces a gain, or solve an investor's cash-flow problem. Money needed for rent, education or a house deposit on a defined date requires an asset-allocation decision before any discussion of shares versus ETFs.
3. What historical stock-market returns actually show
Any historical comparison must specify whether it uses an index, an investable fund, or a portfolio chosen after the fact. Index returns represent methodology-defined benchmarks. Real ETF investors receive the fund's performance, which may diverge because of costs, tracking difference, bid–ask spreads, tax treatment, execution and investor cash flows. Furthermore, dollars, euros and pounds produce different return experiences when exchange rates move.
As a transparent, narrow benchmark illustration, S&P Dow Jones Indices reported the following calendar-year S&P 500 US-dollar total returns, including reinvested dividends: 26.29% in 2023, 25.02% in 2024 and 17.88% in 2025. The same official review reported −18.11% for 2022. These are nominal benchmark returns, before any particular ETF's charges or investor taxes. [5]
| Calendar year | S&P 500 USD total return |
|---|---|
| 2022 | −18.11% |
| 2023 | +26.29% |
| 2024 | +25.02% |
| 2025 | +17.88% |
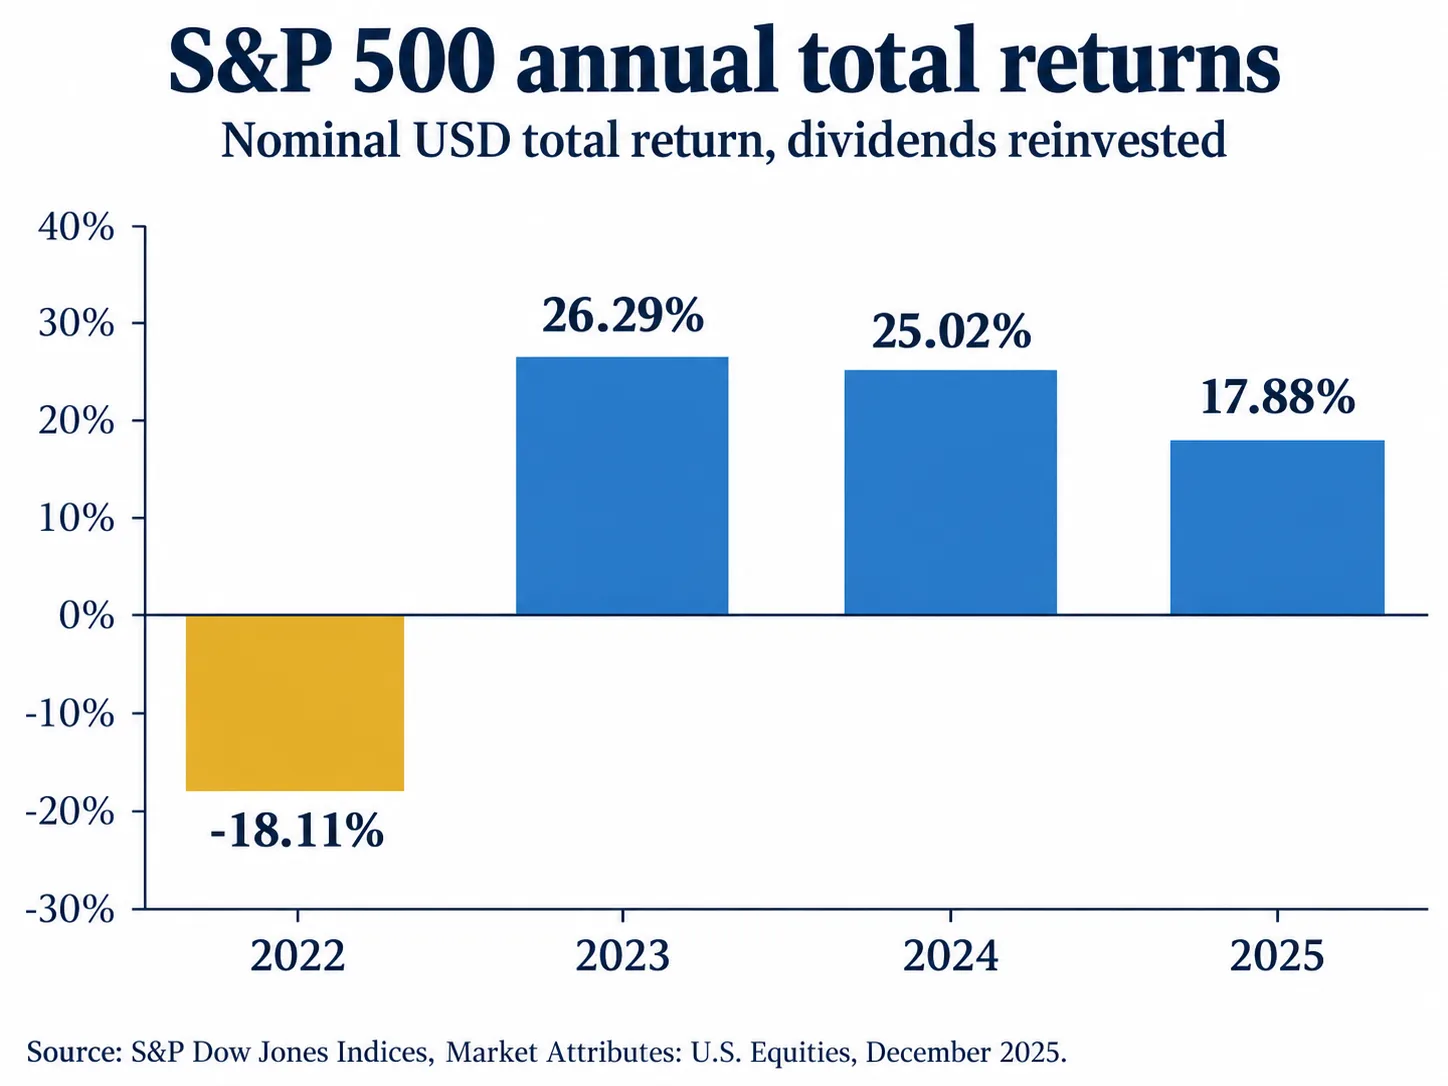
The 2023–2025 cumulative total return, calculated as (1.2629 × 1.2502 × 1.1788 − 1), is +86.12%; this is a calculation from the published, two-decimal calendar returns, not a separately sourced exact index series. The sequence also illustrates why a single good stretch can give an exaggerated impression of how comfortable holding equities will be. A global ETF or a European ETF would have had a different experience, and a European investor's realised euro return on a US-dollar asset would have been affected by currency movements.
It would be misleading to choose a handful of current corporate winners and compare their perfect hindsight returns with an ETF. A valid long-period comparison of portfolios needs a security universe defined at the start, inclusion of delisted firms, consistent dividend adjustments, transaction costs, an appropriate benchmark and a policy for contributions and rebalancing. Comparable rolling 10-, 15- and 20-year multi-index return datasets have not been reconciled in this research edition; a chart asserting those results should not be published without additional extraction and checks.
4. Why picking the winners is harder than it looks
The distribution of stock returns provides a powerful reason for caution. Bessembinder, Chen, Choi and Wei examined more than 64,000 global common stocks between January 1990 and December 2020. Their work found that more than half of US and non-US stocks generated compound returns below those on one-month US Treasury bills over the relevant measured lives. In the same sample, just 2.4% of firms accounted for all net global shareholder wealth creation of US$75.7 trillion. [1]
These are aggregate net wealth-creation results. The measure sums the wealth generated by successful and unsuccessful listed companies relative to the stated benchmark. Some firms outside the winning minority achieved positive returns; others created wealth that was offset by wealth destroyed elsewhere. The headline does not show that 97.6% of stocks fell in price or that purchasing any one broad ETF makes a profit inevitable.
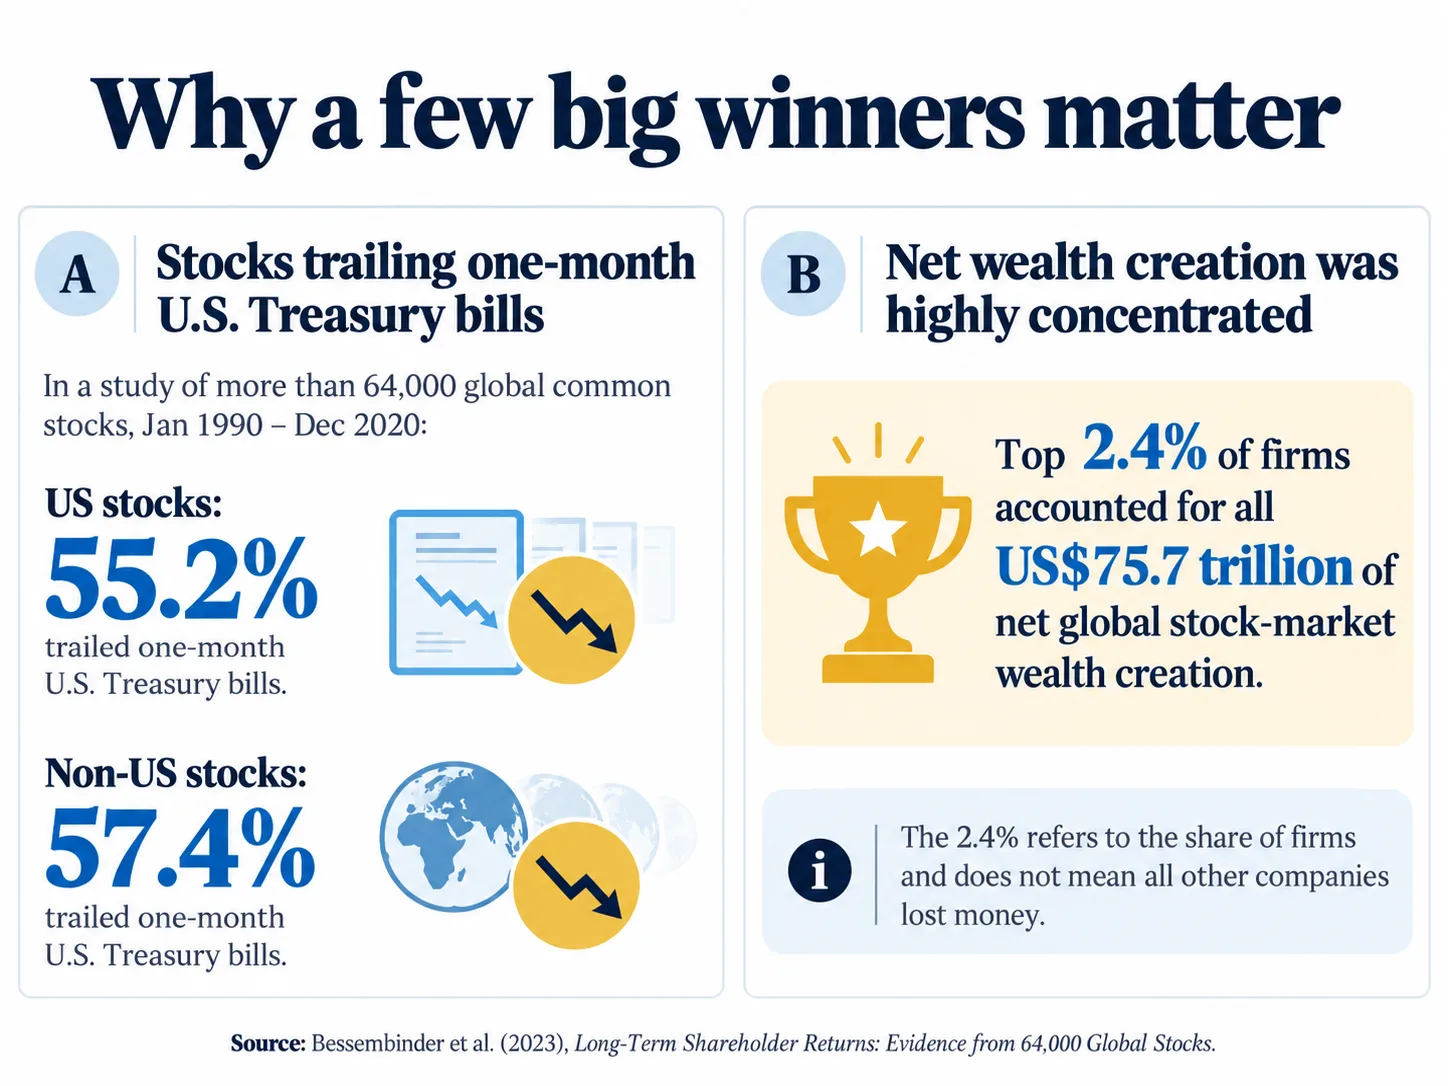
Positive skewness explains much of the challenge: many shares produce unremarkable or weak lifetime outcomes, while a small number of exceptional businesses generate enormous gains. An investor who selects only five or ten stocks can miss most of the ultimate winners. A broad diversified index, while far from perfect, tends to have some exposure to emerging large winners as their weight rises, subject to index eligibility and reconstitution rules.
Importantly, an investor does not necessarily need to identify the few biggest winners to achieve a satisfactory outcome. A carefully diversified active portfolio may outperform a relevant index in particular periods. Nor does the study prove that skilled stock selection is impossible. Its strongest implication is that concentrated portfolios take on meaningful uncertainty about which companies they include, and that hindsight-selected success stories are a poor guide to repeatable stock-picking ability.
5. Professional managers are evidence — but not the same sample
S&P's SPIVA scorecards compare actively managed funds against specified benchmarks. Their methodology addresses fund survivorship and examines relevant horizons. In 2025, 79% of US large-cap active equity funds failed to outperform the S&P 500. In the Europe year-end 2025 scorecard, 71% of euro-denominated active global-equity funds underperformed the S&P World over the year. More than half of the categories examined by SPIVA Europe also recorded particularly low active beat rates. [2][3]
These findings establish that outperforming a benchmark consistently has been difficult for professional fund managers in many samples. They do not establish the exact proportion of private investors who beat an ETF. Fund managers operate under institutional investment mandates, regulatory rules, flows, benchmark constraints and fund-level expenses. Individuals can have different time horizons and may accept positions that would be impractical for a large fund. At the same time, individuals commonly lack teams dedicated to research, risk management and trade execution.
Morningstar's US Active/Passive Barometer provides a complementary comparison: of 3,140 active funds included in its 2025 analysis, 38% survived and outperformed their average passive peer in that single year, with results varying meaningfully by category. This is not the success rate of all individual active investors, and its reference benchmark is a category-based passive peer rather than necessarily the same index used by SPIVA. [6]
Why do longer horizons matter? A fund can beat its benchmark one year because of luck, skill, concentrated factor exposures or a favourable market regime. A repeatable investment edge must endure after all costs and through unfavourable conditions. Investors should scrutinise persistence rather than elevate one-year rankings into a permanent manager or stock-selection skill assessment.
What the 2025 SPIVA scorecard says over 1–20 years
A single calendar-year scorecard is not enough to assess a long-term claim. S&P Dow Jones Indices’ SPIVA US Year-End 2025, Report 1a (page 12) reports the proportion of actively managed US large-cap equity mutual funds underperforming the S&P 500, based on absolute returns, for horizons ending 31 December 2025:
| Period | Funds underperforming the S&P 500 |
|---|---|
| 1 year | 78.78% |
| 5 years | 88.96% |
| 10 years | 85.59% |
| 15 years | 89.93% |
| 20 years | 92.89% |
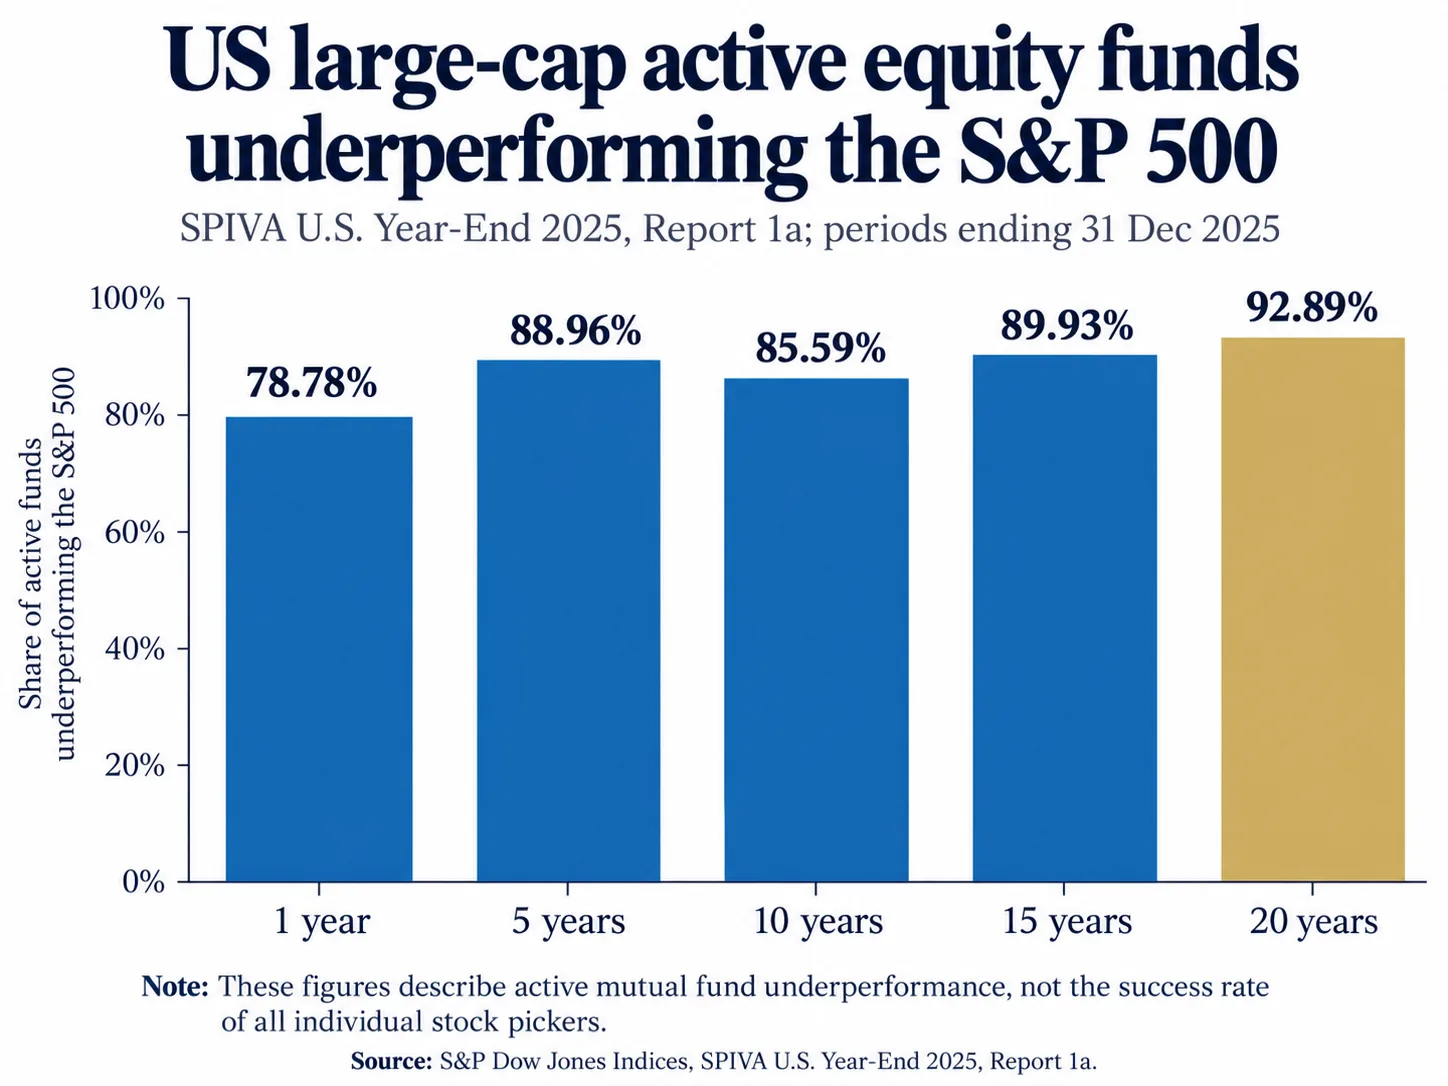
This is substantially stronger long-horizon evidence about professional active management than a one-year comparison. Yet active mutual fund performance is a different research population from self-directed stock portfolios, and it is not a controlled trial comparing one ETF with every possible stock-selection strategy.
6. Expenses: small differences compound
Directly owned stocks do not have an ETF management charge, but they are not costless. Trading commissions, bid–ask spreads, foreign-exchange conversion, custody fees where relevant, withholding taxes and time spent maintaining positions may reduce outcomes. Holding a small number of shares can be operationally simple; maintaining a genuinely diversified direct portfolio with frequent changes can be less so.
ETFs typically charge ongoing expenses and can exhibit positive or negative tracking differences relative to their indices depending on securities lending, taxes, replication and other practical factors. The published fee alone is not the investor's all-in cost. A fund denominated or quoted in euros does not necessarily eliminate the underlying foreign-currency economic exposure of US or global equities.
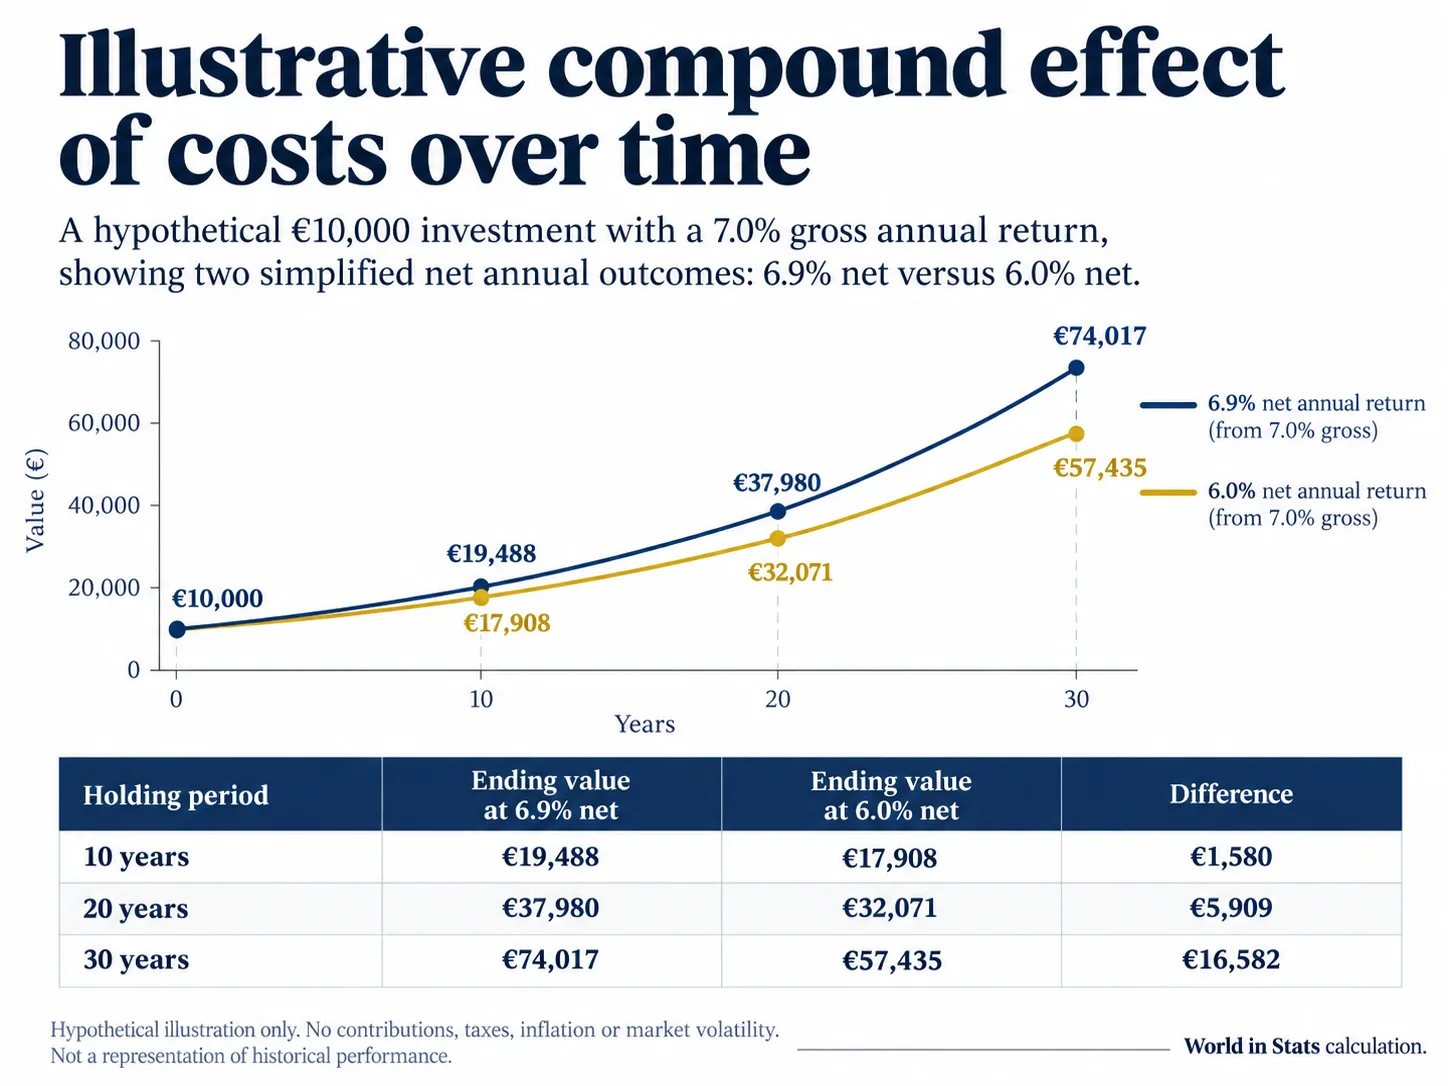
Illustrative compounding model — not a market forecast. Suppose an investor places €10,000 into a hypothetical strategy earning exactly 7.0% each year before the annual charge. Compare a 0.10% annual deduction with a 1.00% annual deduction, simplifying each net return to 6.9% and 6.0% respectively. Assume no contributions, taxes, inflation, trading costs or market volatility, and that the same hypothetical gross return applies to both investments.
| Holding period | €10,000 at 6.9% net | €10,000 at 6.0% net | Difference |
|---|---|---|---|
| 10 years | €19,488 | €17,908 | €1,580 |
| 20 years | €37,980 | €32,071 | €5,909 |
| 30 years | €74,017 | €57,435 | €16,582 |
Method: future value = €10,000 × (1 + annual assumed gross rate − annual assumed charge)^years; rounded to the nearest euro. This deliberately compares hypothetical expense drag rather than alleging that all stock portfolios cost 1% or that every ETF costs 0.10%. An inexpensive set of directly owned stocks could have lower explicit recurring charges than an ETF; the more important question is its risk-adjusted net return and operational sustainability.
For European investors, UCITS status, fund domicile, available share classes and the broker's actual fee schedule can materially affect implementation. For investors resident in Portugal, tax on realised securities gains, dividends, the treatment of holding periods and foreign withholding may depend on the taxpayer's circumstances and the applicable law at disposal. Because this editorial review has not verified the precise Portuguese tax provisions in force in October 2026 from original tax authority documents, it makes no numerical Portuguese tax-rate or exemption claims. Investors should confirm current rules with the Autoridade Tributária or a qualified adviser before acting.
7. Volatility, drawdowns and losing capital
Annualised volatility estimates how dispersed periodic returns were in a historical series. Maximum drawdown measures the largest observed peak-to-trough fall over a defined period. Neither statistic precisely predicts the next crisis. A portfolio with few companies may suffer a permanent impairment that a diversified market fund can partly absorb; in contrast, a broad equity ETF can experience severe temporary losses because it remains exposed to the equity market itself.
The −18.11% S&P 500 total return in 2022 is a verified one-year example of a bad outcome for a diversified US equity benchmark. It is not the index's maximum drawdown for that year, which requires daily or monthly peak-to-trough observations and potentially a different measurement. [5]
Concentration introduces idiosyncratic tail risk: a business can face insolvency, litigation, disruption or competition severe enough to destroy most or all of an investor's position. But concentration also creates the possibility of exceptional relative gains when a selected company greatly outperforms. A responsible comparison must discuss both tails and resist the habit of measuring risk only with the returns of surviving corporate winners.
For investors approaching a fixed spending deadline, the most important risk might be a market decline immediately before a withdrawal. Changing from an equity ETF to ten individual stocks would not reliably address that problem. Matching assets with financial liabilities and time horizons is more important than choosing a fashionable investment wrapper.
8. Time, research and investor behaviour
Owning individual companies intelligently can require understanding products, customers, financial statements, debt, cash flow, industry structure, valuation, governance and capital allocation. Investors must also decide when to sell and whether a deteriorating company thesis is temporary or structural. There is no evidence-based universal rule that every stock demands a fixed number of research hours.
A broad index ETF lowers the need to forecast individual companies, but it does not eliminate essential decisions. The investor must still select an appropriate equity exposure, understand the index's geography and concentration, compare fund costs, plan the rebalancing of their overall asset allocation and resist emotionally driven trading.
Barber and Odean analysed the trading of 66,465 households at a large discount broker during 1991–1996. The most active traders in their sample earned 11.4% annually, against 17.9% for the market in the study comparison; the average sampled household earned 16.4%. The study is historical, broker-specific and cannot establish contemporary worldwide retail results. It nevertheless documents a material relationship between high turnover and poor net outcomes within that sample. [7]
Morningstar's Mind the Gap US 2026 examined fund investor cash flows over the ten years ending December 2025. The average dollar invested earned 8.7% a year, versus 9.9% aggregate annual total return for the studied mutual funds and ETFs, a gap of 1.2 percentage points per year. The comparison concerns money-weighted investor experience versus time-weighted fund performance; it is not a causal trial proving any one investor mistake. [4]
Together, this evidence supports a practical discipline: use understandable exposures, know the costs, establish a contribution and rebalancing policy, and avoid making frequent changes solely in response to the recent past.
9. When individual shares may make sense
Direct shares can be appropriate for investors who want to understand and select specific businesses, express a deliberate thesis and accept the possibility of performing much worse than a diversified benchmark. Direct holdings also permit excluding particular companies, focusing on business fundamentals and tailoring a portfolio to personally chosen constraints.
Stock selection has genuine theoretical upside: an investor can hold a company that subsequently beats the market by a very wide margin. But that opportunity is not a free expected-return premium. It comes with the possibility of fundamental misjudgement, purchasing the right business at an excessive valuation, underestimating competitive threats or simply choosing a portfolio that lacks the period's major winners.
A disciplined direct-stock approach should define a business thesis, valuation discipline, position limits and criteria for changing a view. It should also compare returns with an appropriate total-return benchmark after costs and taxes rather than with cash contributions alone. An investor holding eight correlated technology companies should not describe the portfolio as globally diversified merely because there are eight ticker symbols.
The most compelling justification for individual shares is not that they inevitably outperform. It is that a sufficiently prepared investor values direct control and is willing to pay the costs—in time, uncertainty and possibly lower returns—of acting on individual-company research.
10. When diversified index ETFs have the stronger case
For an investor whose aim is broad equity participation rather than company selection, a globally diversified low-cost index ETF offers a compelling package: exposure to many companies, transparent index rules, relatively straightforward maintenance and a fee that can be examined in fund documentation. It reduces the consequences of accidentally concentrating all capital in a company that later fails, while still enabling exposure to businesses that become large market winners.
The biggest caveat is that not all ETFs provide this benefit. Single-stock ETFs, narrow thematic funds, highly leveraged ETFs, and funds tracking just a few correlated securities can remain risky or concentrated. Even familiar US-only broad-market products entail geography and company-weight concentration. Choosing a recognised ETF label is not a substitute for reading the underlying index, holdings, currency exposure and risks.
A low-cost equity ETF should therefore be seen as an efficient instrument for a chosen asset allocation, not as the asset allocation itself. An investor with a short horizon or low tolerance for large temporary losses may need cash, short-duration high-quality fixed-income instruments or other suitable assets alongside—or instead of—equities.
11. Can investors combine both approaches?
A core-satellite structure retains a diversified ETF portfolio as the foundation while allowing a smaller amount of capital for individual company research. Illustrative examples are 100% diversified ETFs, 90% diversified ETFs with 10% direct shares, or 80% diversified ETFs with 20% direct shares. These are illustrations, not allocations suitable for everyone, and they do not imply that adding direct shares increases expected returns.
The benefits are chiefly practical: a core maintains broad exposure while a satellite gives the investor a bounded space to pursue company-specific research. The risks include duplication of companies already heavily represented in the ETF core, increased concentration in popular sectors and the temptation to continually enlarge the satellite following recent gains.
Effective implementation starts with an overall portfolio-level risk budget. Count the exposure to a company held directly and indirectly via funds; set position limits; decide how often to review; and evaluate both the total portfolio and the satellite against appropriate benchmarks. Selling after every short-term disappointment or doubling down on every recent winner is not the same as disciplined long-term investing.
Worked example: a €10,000 core–satellite equity allocation
Suppose an investor puts €9,000 (90%) into a broad equity index ETF and €1,000 (10%) into selected individual shares. If that investor buys five equally weighted stocks in the satellite sleeve, each position is initially €200, or 2% of the total portfolio. If a company already represents 5% of the ETF, and one selected stock is that same company, the investor’s effective exposure is approximately €450 via the ETF plus €200 directly, or 6.5% of the whole portfolio. This arithmetic assumes the fund’s holding weight remains 5%, with no price moves, and illustrates overlap rather than a real fund portfolio.
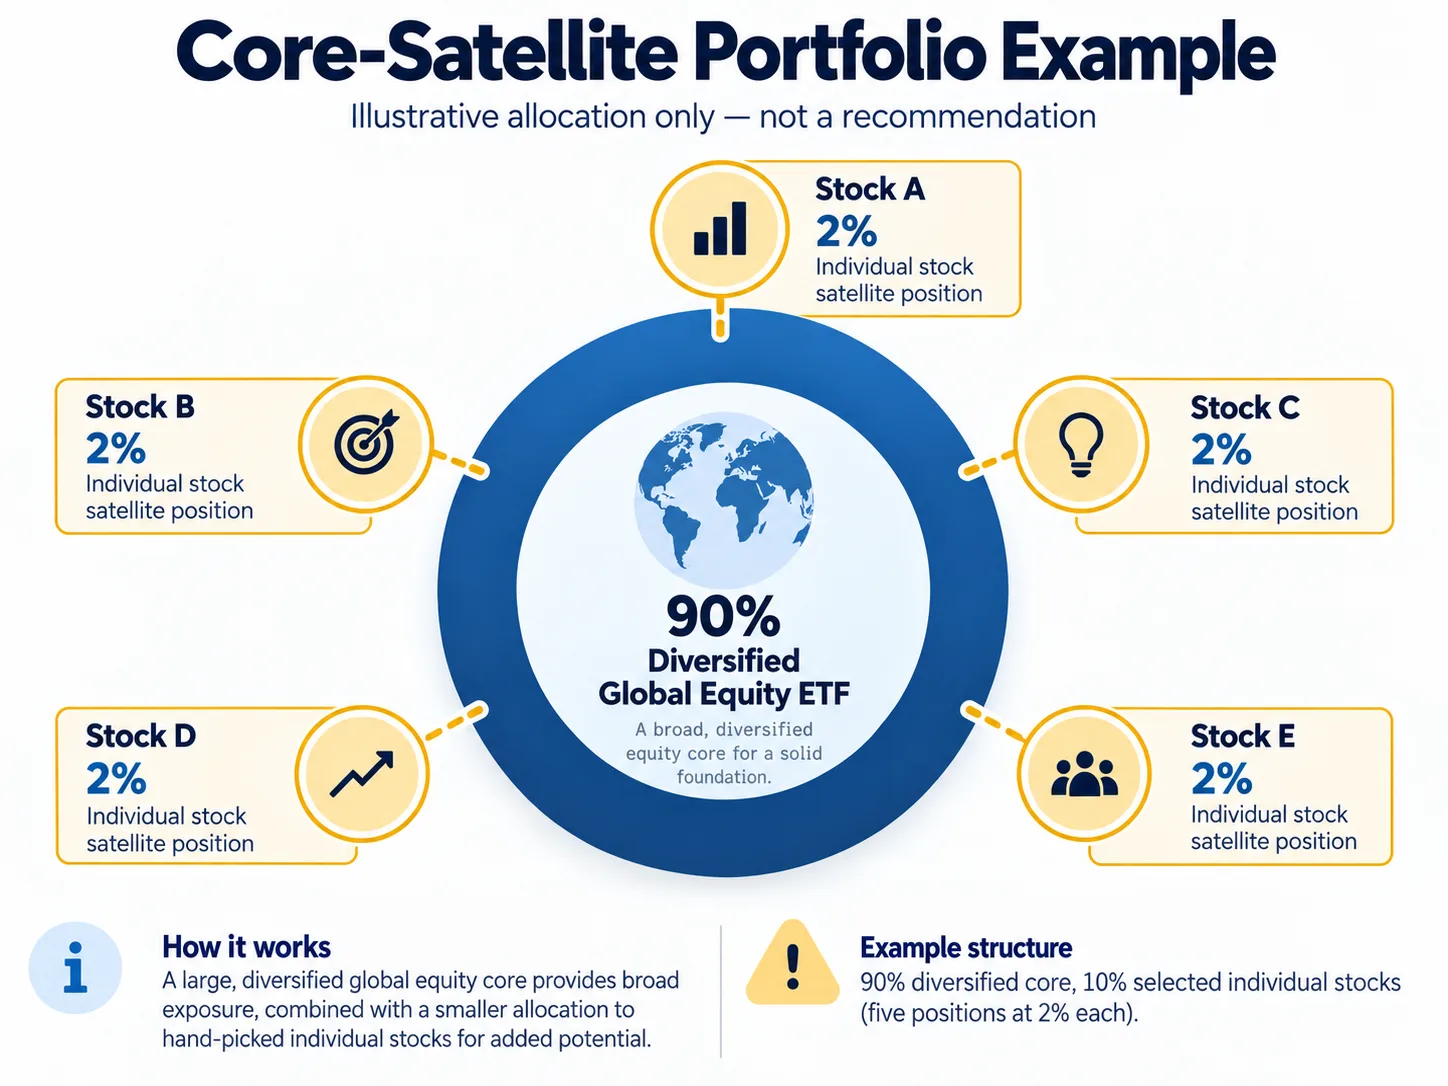
The hybrid portfolio retains the market risk of its broad equity exposure; the shares add active bets and potential tax/trading complexity. It is not mathematically guaranteed to improve expected return or reduce downside risk relative to holding only the diversified fund.
Plain-English glossary
Tracking difference: how far a fund's realised performance departs from its benchmark over a specified period; fees, taxes, trading and securities lending can all affect it. Maximum drawdown: the largest peak-to-trough fall observed over a defined data interval; it is not an estimate of the worst possible future loss. Money-weighted return: a return measure that takes the timing and size of investor cash flows into account. Survivorship bias: a distortion that arises if a dataset excludes funds or companies that closed or disappeared.
12. Decision matrix: what is most defensible for whom?
| Investor profile | Most defensible starting approach | Why | Important qualification |
|---|---|---|---|
| Beginner with limited knowledge | Broad, low-cost index ETF, if equity risk is suitable | Avoids immediate need to select several firms | Understand market losses and maintain emergency liquidity |
| Long-term simplicity seeker | Broad index ETF | Lower ongoing complexity | One narrow ETF may not provide global diversification |
| Global-diversification seeker | Broad global index ETF | Many countries and industries in one vehicle | Examine country and mega-cap concentrations |
| Enthusiastic company researcher | Diversified core plus bounded direct-stock allocation | Allows research without making every outcome depend on it | Monitor duplication and position sizes |
| Investor deliberately pursuing outperformance | Individual shares or active satellite, with clear benchmark | Permits active deviations and concentrated convictions | A high chance of benchmark-relative disappointment remains |
| Investor with very limited time | Broad low-cost index ETF | Lower monitoring burden | Asset allocation still requires periodic review |
| Investor comfortable with both | Core-satellite structure | Combines breadth and direct-company choice | Complexity and costs may rise |
| Investor with low tolerance for loss | Review overall allocation; potentially less equity | A stock-versus-ETF choice does not remove equity risk | Consider suitable lower-risk assets and horizon |
| Investor near fixed withdrawal date | Liability-matched, diversified allocation; not equity-only | Reduces dependence on market level at withdrawal | Specific asset choice depends on date, currency and needs |
| Investor prioritising tax simplicity | Check local tax rules; often fewer funds/transactions | Can simplify recordkeeping | Accumulating fund treatment and cross-border taxes vary |
Evidence-led verdict for most investors: provided an equity allocation fits their objectives and capacity for loss, a broadly diversified, low-cost index ETF is the strongest default. For experienced researchers: individual shares can be a legitimate choice, but should be judged against a relevant after-cost total-return benchmark. For investors who value both: a deliberately limited satellite of researched shares can coexist with a diversified ETF core. The critical decision is not choosing an identity as an “ETF investor” or a “stock picker”; it is building a process that is appropriate, repeatable and survivable.
Conclusion — Owning the market or trying to select its winners
Both approaches ultimately expose the investor to businesses and financial markets. Direct shares concentrate control and responsibility in the selection of companies. Broad index ETFs distribute that selection across a published set of holdings and index rules. Evidence on stock-return concentration, active-manager underperformance and investor trading behaviour gives a substantial reason to favour the second approach as a default—not because the future is certain, but because identifying future winners reliably is difficult and avoidable friction compounds.
There are good reasons to research and own individual businesses. The key is to recognise what one gains—control and a possibility of exceeding the benchmark—and what one accepts: research work, concentrated errors and potential underperformance. A successful long-term plan should put financial goals, risk capacity, costs and behaviour before the appeal of a specific ticker symbol.
Historical evidence is not a forecast. This article is general educational research and should not be treated as personalised advice.
Sources & references
- Bessembinder et al. (2023), Long-Term Shareholder Returns
- S&P SPIVA U.S. Year-End 2025
- S&P SPIVA U.S. Year-End 2025 full report
- S&P SPIVA Europe Year-End 2025
- Morningstar, Mind the Gap
- S&P, Market Attributes U.S. Equities Dec 2025
- Morningstar, Active/Passive Barometer 2025 review
- Barber and Odean (2000), Trading Is Hazardous to Your Wealth
Found an error? Contact us with the source and passage to correct.