Companies & Stocks
Meta Platforms in 2026: The Advertising Cash Engine Meets the AI Capital-Spending Test
Combining an accessible business analysis with historical cash-flow evidence, peer economics, an illustrative DCF and a conditional reverse DCF.

Key takeaways
- Family of Apps achieved 51.6% operating margin in FY2025, while Reality Labs lost $19.193bn.
- Meta's FY2025 advertising revenue represented 97.6% of consolidated sales.
- FY2025 operating cash flow rose, but Meta-defined FCF fell to $43.585bn as cash capital spending increased.
- The revised 2027–2036 DCF is illustrative; $6.6bn enterprise-to-equity adjustment and 2.57bn assumed shares remain unverified.
- Base-case valuation depends on substantial capex normalisation and roughly 77% terminal value, which creates high model risk.
- A reverse DCF and operating peer table provide perspective but do not establish a margin of safety.
- Q3 2026 reporting and rights to five uploaded photographs remain outstanding before publication.
Executive summary: an advertising cash engine faces an AI spending test
Meta's Family of Apps (FoA) remains an unusually profitable advertising operation, but its growing commitment to AI infrastructure and Reality Labs makes the returns on incremental capital central to any investment thesis.
According to its FY2025 disclosures, Meta generated $200.966 billion in revenue, $83.276 billion in consolidated operating income and $60.458 billion in net income. Family of Apps generated $198.759 billion in revenue and $102.469 billion in operating income, while Reality Labs generated $2.207 billion in revenue and an operating loss of $19.193 billion. [1]
Q2 2026 brought a striking divergence: revenue increased 28% year over year to $60.801 billion while reported consolidated operating income decreased to $18.775 billion. Company-defined quarterly free cash flow amounted to $0.784 billion, reflecting substantial cash investment and including finance-lease principal in the definition. [2]
Our investment assessment (research date 20 October 2026): Meta is a high-quality advertising business, but a reliable estimate of equity fair value is not yet established. The updated, explicitly illustrative ten-year DCF produces Bear/Base/Bull scenario outputs of approximately $126 / $770 / $1,686 per assumed share, replacing—not independently correcting—the former $186 / $715 / $1,649 model. Debt, leases and dilution are still not fully reconciled. The working historical closing-price reference for 19 October is $705.44; the earlier $705.53 vendor discrepancy still requires final resolution. These are not certified fair values or prices to target. [5]
Publication status: this is a research draft under editorial review. It does not include Q3 2026 results; an investor event was scheduled for 21 October 2026. [3]
Key financial figures
| Metric | Reported result | Period |
|---|---|---|
| Revenue | $200.966bn | FY2025 |
| Operating income | $83.276bn | FY2025 |
| Net income | $60.458bn | FY2025 |
| Operating margin | 41.4% | FY2025; calculated |
| Operating cash flow | $115.800bn | FY2025 |
| Meta-defined free cash flow | $43.585bn | FY2025 |
| Q2 revenue | $60.801bn | Q2 2026 |
| Q2 operating income | $18.775bn | Q2 2026 |
| Q2 Meta-defined FCF | $0.784bn | Q2 2026 |
| Cash and marketable securities | $90.26bn | 30 June 2026 |
| Long-term debt | $83.66bn | 30 June 2026 |
All dollar amounts are USD. References [1] and [2] are linked at the end.
1. How Meta makes money: attention, auctions and advertising

Meta's most established economic engine is advertising across Facebook, Instagram, Messenger and WhatsApp. An advertiser bids for opportunities to reach users. Recommendation and ranking systems determine which content and ads are delivered, and advertisers ultimately evaluate the resulting sales, leads and customer-acquisition costs.
More users do not automatically mean more profit. Revenue depends on time spent, ad inventory, effective ad load, demand, the quality of matching, geographic mix and average price per delivered ad. Profit emerges only after infrastructure, moderation, personnel, development, legal and depreciation costs.
Meta reports Family of Apps and Reality Labs as operating segments. It does not disclose independently audited Instagram, Facebook or WhatsApp operating profit. A numerical profit margin assigned to an individual app would therefore be an analyst estimate rather than a reported fact. [1]
2. Revenue concentration and segment profitability
| FY2025, USD bn | Revenue | Operating income | Operating margin |
|---|---|---|---|
| Family of Apps | 198.759 | 102.469 | 51.6% |
| Reality Labs | 2.207 | −19.193 | Not meaningful |
| Consolidated | 200.966 | 83.276 | 41.4% |
| Advertising revenue category | 196.175 | Not separately reported | — |
Advertising represented roughly 97.6% of FY2025 consolidated sales. Family of Apps represented roughly 98.9%. The core franchise's operating profit is greater than the consolidated result because Reality Labs losses reduce it. This is real capital allocation, not merely a presentation detail. [1]
In Q2 2026, FoA contributed approximately $60.37 billion in revenue and $23.394 billion of operating profit, while Reality Labs contributed about $0.431 billion in revenue and a $4.619 billion operating loss. [2]
3. Operating growth versus cash generation
FY2025 revenue rose from $164.501 billion in FY2024 to $200.966 billion, approximately 22.2% growth. Consolidated operating income grew about 20.0%, from approximately $69.38 billion to $83.276 billion; the consolidated operating margin eased from about 42.2% to 41.4%. [1]
In Q2 2026, revenue rose from $47.516 billion to $60.801 billion while reported operating income fell from $20.441 billion to $18.775 billion. Costs included disclosed litigation-related charges and severance; an illustrative adjusted figure could exclude these amounts, but they were still real reported costs. [2]
| Period, USD bn | Operating cash flow | Capex plus finance-lease principal | Meta-defined FCF |
|---|---|---|---|
| FY2024 | 91.328 | 39.225 | 52.103 |
| FY2025 | 115.800 | 72.215 | 43.585 |
| H1 2025 | 49.587 | 30.704 | 18.883 |
| H1 2026 | 64.088 | 50.918 | 13.170 |
| TTM June 2026 | 130.301 | 92.429 | 37.872 |
Trailing-twelve-month figures use FY2025 + H1 2026 − H1 2025, based on consistent source definitions. [1][2]
Despite growing operating cash flow, Meta's free cash flow contracted as cash investment expanded. Accounting income does not expense the entire cost of a newly built data centre immediately; cash investment arrives earlier and depreciation follows over its useful life. That timing matters intensely for an AI infrastructure buildout.
4. Advertising moat: scale with vulnerabilities
In June 2026, Meta reported approximately 3.60 billion average daily active people across Family of Apps, up about 3% year on year. With penetration already large, revenue growth increasingly depends on engagement and monetisation, not just more people. [2]
Q2 reported advertising impressions rose 14% and average price per ad rose 12%. Their product suggests approximately 27.7% change before rounding and mix effects, close to the reported 28% revenue growth. This does not prove that AI caused the improvement: advertising demand, currency, product mix and auction effects also matter. [2]
Competition is not restricted to other social networks. YouTube competes for viewing time, TikTok for short-form attention, and advertisers can shift budgets to search or alternative acquisition channels. Scale offers network benefits but does not guarantee that advertisers receive attractive incremental returns.
5. Artificial intelligence: direct improvements and speculative options

Meta's AI spending has three distinct economic rationales. First, recommendation and ad-delivery systems can improve outcomes inside an existing commercial engine. Second, generative ad creation and automation can make campaign production easier. Third, assistants, Llama-based systems and future consumer services might create new markets, although monetisation is not yet sufficiently demonstrated in reported accounts.
These should not receive the same confidence level. AI infrastructure requires GPUs, servers, cooling, electricity, networking and replacement investment. Obsolescence or higher compute requirements could compress future returns, even if ad technology becomes more capable.
The missing disclosure is an AI-only return on invested capital. Meta does not report the incremental after-tax profit and capital employed for its AI operations separately. Any precise AI project ROIC asserted without a reconciliation would be speculative.
6. Reality Labs: potential platform, measurable losses

Reality Labs invests in immersive technologies, augmented reality and smart glasses. The optimistic case is that new hardware interfaces could become important computing platforms. But product adoption is not the same as corporate-scale sustainable profitability.
The cautious case begins with disclosed financials: $2.207 billion of 2025 revenue against a $19.193 billion operating loss. That loss was around 8.7 times reported revenue; this ratio describes severe negative operating economics, not a forecast of permanent failure. [1]
Segment operating loss is not identical to cash burn because of non-cash charges and capital spending outside the segment presentation. A credible standalone valuation would need product-level revenues, invested capital, relevant infrastructure costs and long-run returns, which cannot be fully constructed from the available segment data.
7. Free cash flow, capex and capital allocation
Meta defines free cash flow as operating cash flow minus purchases of property and equipment and principal payments on finance leases. In Q2 2026, $31.862 billion in operating cash flow less $30.116 billion of property/equipment purchases and $0.962 billion in finance-lease principal equals $0.784 billion. [2]
For FY2026, management expected $130–145 billion of capital expenditure including finance-lease principal. It is essential to keep cash-flow definitions comparable. [2]
Importantly, Meta-defined FCF is not FCFF. Enterprise DCF generally uses after-tax operating profit plus depreciation, minus capital investment and change in working capital. Mixing those definitions can create an inconsistent valuation.
Meta pays dividends and may repurchase shares, but authorisations are not the same as completed buybacks. Stock compensation, shares issued and net diluted share count all matter. The research PDF reports no open-market Class A stock repurchases in the first-half 2026 financing table, with $2.699 billion in dividends and dividend equivalents and $8.704 billion of employee-award net settlement tax payments; these classifications merit reconciliation before using them to infer net shareholder returns. [2]
8. ROIC: the appropriate test of investment success
ROIC = after-tax operating income (NOPAT) / average invested operating capital. Estimating a comparable historical series requires choices about excess cash, non-operating assets, leases, goodwill, deferred taxes and exceptional items.
A historical Meta-wide ROIC series would require yearly NOPAT, opening and closing invested operating capital, tax-normalisation conventions, and explicit treatment of goodwill, excess cash and leases. The supplied research does not verify a consistent 2016–2025 ROIC series. It would be misleading to present one as audited or to equate Meta-wide ROIC with the incremental returns on newly acquired AI infrastructure.
Illustration, not Meta data: a $10 billion investment earning $600 million of sustainable after-tax operating profit yields a 6% return. If comparable-risk capital costs 9%, annual economic profit is negative by approximately $300 million despite positive accounting earnings.
Evaluating incremental AI returns
Separate advertising performance (impressions, average ad pricing, conversion and margins), physical infrastructure investment (cash PP&E, leased equipment and committed facilities), accounting effects (depreciation lives and useful-life changes), and cash outcomes (operating cash flow, free cash flow and normalized incremental NOPAT). They cannot be collapsed into a measured “AI ROI” without a disclosed allocation of capital and benefits.
9. Liquidity and financial flexibility
At 30 June 2026, Meta reported approximately $90.26 billion in cash and marketable securities and $83.66 billion in long-term debt. These figures alone are not sufficient to calculate enterprise net debt: current obligations, financial and operating leases, investments and other financing claims must be reconciled. [2]
High operating cash generation provides capacity to invest, but persistent spending above cash generated after investment may constrain distributions or require financing. Long-term equipment replacement economics are more important than a simple cash-minus-debt headline.
10. Competition, governance and regulation
Mark Zuckerberg's voting control supports strategic consistency but reduces the influence of minority shareholders over major capital allocation decisions. Whether such concentrated control creates value depends heavily on management discipline and financial returns.
Privacy constraints, US competition issues and EU digital-market rules can affect ad measurement, litigation costs and product design. This research does not claim a current legal-case register has been fully audited; exact proceedings, appeal stages and penalties still require primary-document verification.
Alphabet is a useful competitor for advertising economics but its search and cloud businesses make whole-company margins imperfect comparators. TikTok and Snapchat compete for attention but differ substantially in ownership structure, public disclosure and scale.
11. Historical earnings and shareholder economics: 2023–2025
The latest annual filing supports a consistent three-year comparison, shown below. This is not a verified ten-year history; the remaining 2016–2022 observations require filing-by-filing reconciliation before expanding the time series. [1]
| Metric (USD bn, except margins) | 2023 | 2024 | 2025 |
|---|---|---|---|
| Revenue | 134.902 | 164.501 | 200.966 |
| Operating income | 46.751 | 69.380 | 83.276 |
| Operating margin | 34.7% | 42.2% | 41.4% |
| Net income | 39.098 | 62.360 | 60.458 |
| Operating cash flow | 71.113 | 91.328 | 115.800 |
| Cash PP&E purchases | 27.045 | 37.256 | 69.691 |
| Finance lease principal | 1.058 | 1.969 | 2.524 |
| Meta-defined free cash flow | 43.010 | 52.103 | 43.585 |
| Stock-based compensation | 14.027 | 16.690 | 20.427 |
| Class A share repurchases (cash) | 19.774 | 30.125 | 26.248 |
Interpretation. In 2025 revenue increased 22.2%, while operating profit rose approximately 20.0%. Yet free cash flow declined by about $8.518bn (16.3%) because reinvestment increased more quickly than operating cash. Reported net income fell even though operating profit grew; the tax provision rose from approximately $8.303bn in 2024 to $25.474bn in 2025. A purely earnings-per-share interpretation would miss both the tax effect and the cash investment cycle. [1]
Different FCF definitions matter: 2025 operating cash flow less cash PP&E purchases equalled $46.109bn; deducting finance-lease principal yields $43.585bn under Meta's definition. Neither automatically equals unlevered FCFF used in an enterprise DCF.
Capital allocation: buybacks, dividends and dilution
In FY2025 Meta spent approximately $26.248bn repurchasing Class A shares, distributed $5.324bn in dividends and equivalents, and recognised $20.427bn of share-based compensation. These numbers should not be netted simplistically to determine value creation. SBC is not an equivalent cash payment to employees, and the economic impact depends on issued awards, settlement, dilution and the cost of repurchases. A verified beginning/end share bridge remains outstanding. [1]
12. Ten-year DCF: updated illustrative model and limitations
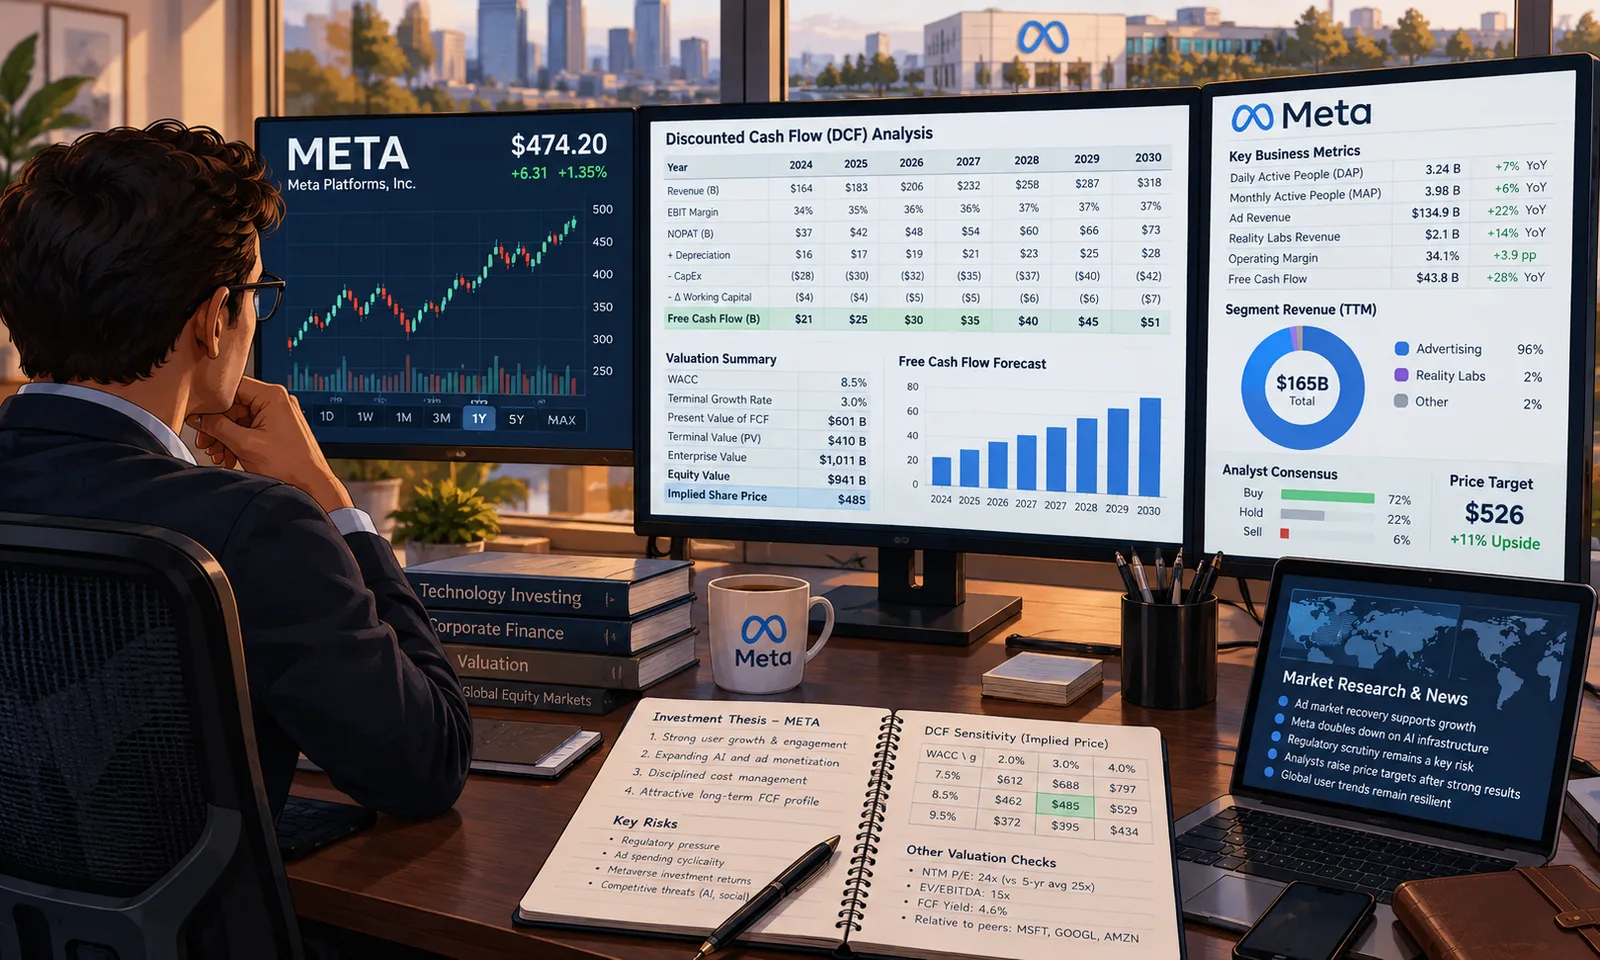
The revised research includes a new transparent ten-year model for 2027–2036. It is not a validated correction of the earlier $186/$715/$1,649 estimates: the underlying spreadsheet for that earlier calculation was not supplied. Do not compare the new and old results as though only errors were repaired.
The starting 2026 revenue assumption is $250bn; the model uses an illustrative 18% operating tax rate, reinvestment in working capital equal to 1% of incremental revenue, and scenario-specific revenue growth, EBIT margins, depreciation, capex, WACC and terminal growth. These are analyst assumptions, not guidance or audited results. FCFF is calculated as after-tax EBIT + D&A − operating capital reinvestment − investment in working capital. Under a consistent lease-adjusted enterprise DCF, financing lease liabilities, interest and lease-related depreciation must be handled in coordination with operating forecasts and the equity bridge. Capital spending initiated through a financing arrangement should not disappear from the economic reinvestment model merely because it was non-cash at inception. Equally, subtracting finance-lease principal from FCFF and then subtracting the entire corresponding liability from enterprise value without reconciling cash-flow conventions risks double counting.
| Scenario | Revenue growth 2027 → 2036 | EBIT margin 2027 → 2036 | WACC | Terminal growth | Operating enterprise value | Illustrative value/share |
|---|---|---|---|---|---|---|
| Bear | 8% → 3.5% | 29% → 30% | 11.0% | 2.5% | $317.4bn | $126 |
| Base | 15% → 7.0% | 35% → 39% | 9.0% | 3.0% | $1,972.1bn | $770 |
| Bull | 21% → 10.0% | 40% → 44% | 8.5% | 3.5% | $4,325.8bn | $1,686 |
Critical qualification: The reported model still relies on an unverified $6.6bn aggregate enterprise-to-equity adjustment and 2.57bn assumed shares. Lease, debt, restricted cash and non-operating asset treatment are not fully reconciled. Therefore the per-share columns are conditional model outputs, not defensible investment price targets.
The Base-case cash-flow pathway
The following selected points convey why the Base-case valuation is sensitive to a major decline in investment intensity:
| Year | Revenue | Capex | D&A | Modelled FCFF |
|---|---|---|---|---|
| 2027 | $287.5bn | $145.0bn | $37.0bn | −$25.9bn |
| 2030 | $417.3bn | $127.0bn | $49.7bn | $46.5bn |
| 2033 | $563.8bn | $109.0bn | $62.3bn | $127.0bn |
| 2036 | $708.0bn | $91.0bn | $75.0bn | $209.9bn |
The reduction in capex from $145bn to $91bn while revenue climbs from $287.5bn to $708bn is economically consequential. It implies sharply lower capital intensity despite continued growth, and requires explicit support from hardware useful lives, maintenance and replacement capex, data-centre productivity and committed infrastructure plans. A linearly declining spending path is not evidence that it will happen. Specifically, modelled capex falls from 50.4% of revenue in 2027 to 12.9% in 2036, a major improvement in capital efficiency that remains unproven. An additional high-for-longer capex scenario would be necessary to test the downside to sustainable owner cash flow.
In the Base model, discounted explicit cash flows amount to approximately $449.7bn, compared with approximately $1,522.4bn of discounted terminal value: around 77% of operating enterprise value depends on cash flows after 2036. Crucially, the terminal calculation capitalises 2036 FCFF without independently rebuilding steady-state reinvestment. This may overstate sustainable terminal economics. The Gordon-growth formula terminal value = sustainable next-year FCFF / (WACC − perpetual growth) requires reinvestment sufficient to support that growth, including replacement of aging computing equipment. Multiplying end-of-forecast FCFF by (1 + g) without reconstructing steady-state reinvestment is an economic assumption, not proof.
WACC and perpetual-growth sensitivity
| WACC / perpetual growth | 2.0% | 2.5% | 3.0% | 3.5% |
|---|---|---|---|---|
| 8.0% | $834 | $896 | $970 | $1,061 |
| 9.0% | $680 | $722 | $770 | $827 |
| 10.0% | $567 | $596 | $629 | $667 |
| 11.0% | $481 | $501 | $525 | $552 |
All amounts per assumed share, conditional on the same unverified equity bridge and dilution inputs. Small changes in discount rates and perpetuity assumptions generate large changes in valuation, even without altering the explicit forecast.
Reverse DCF: what might the reference price imply?
The revised paper uses $705.44 as a dated 19 October reference, rather than leaving two vendor prices in the headline. The original exchange-session close and any conflicting feeds should still be finally reconciled before publication.
At $705.44 and assumed 2.57bn shares, conditional implied equity value is approximately $1,812.98bn, and assumed operating EV is approximately $1,806.4bn after subtracting the provisional $6.6bn bridge. Holding each scenario's remaining assumptions fixed and changing only 2027 revenue growth yields:
| Assumption set | Implied 2027 revenue growth | Implied 2036 sales |
|---|---|---|
| Bear | 33.1% | $1,300.8bn |
| Base | 13.3% | $657.2bn |
| Bull | 3.1% | $471.3bn |
The underlying model workbook was not supplied with the new Markdown, so these reported solutions have not been independently rerun. They hold scenario-specific margins, WACC, terminal growth, capital intensity and other model assumptions fixed, varying only the initial growth input. These are conditional mathematical solutions, not a unique set of market expectations. Price alone cannot separately reveal what the market assumes about margins, future capex, discount rates and reinvestment. A stronger follow-up would provide a two-dimensional reverse DCF, comparing combinations of revenue growth and sustainable capex intensity, rather than treating the single implied growth number as the market's forecast.
What must be verified before an investable price target
A valid enterprise-to-equity bridge must reconcile current debt and maturities, operating and finance leases, excess versus operating cash, non-operating holdings and economic dilution. The forecast also needs a 2026 asset and depreciation base consistent with actual spending, sustainable terminal capex and the latest quarterly results. A valid bridge would show each balance separately (excess cash and marketable securities, current and long-term borrowings, finance-lease obligations, operating leases where capitalized, material non-operating assets, minority claims and economically diluted shares), its reporting date, and the reason it is added or subtracted. Until then the proper conclusion remains valuation inconclusive.
13. Peer comparison: Meta, Alphabet and Snap
Published FY2025 statements permit an operating comparison, although business mixes and accounting definitions differ. For example, Alphabet's search and YouTube businesses differ from Meta's feed advertising, and Alphabet also has Google Cloud. Snap is a far smaller, loss-making operating peer.
| FY2025 figure | Meta | Alphabet | Snap |
|---|---|---|---|
| Revenue | $200.966bn | $402.836bn | $5.931bn |
| Annual revenue growth | 22.2% | 15.1% | 10.6% |
| Operating margin | 41.4% | 32.0% | Approx. −9% |
| Operating cash flow | $115.800bn | $164.713bn | $0.656bn |
| Operating cash-flow margin | 57.6% | 40.9% | 11.1% |
Source: FY2025 annual reports for each company as transcribed into the revised research; competitor figures must be checked against original filings before final approval.
The available research has not reconciled P/E, EV/EBIT or EV/FCF using simultaneously dated prices, financing claims and consistent cash-flow definitions. It would be misleading to invent them. This table therefore shows operating economics rather than claiming to prove relative cheapness.
14. What would change the thesis?
Constructive signals: sustained advertising impressions and pricing without comparable cost growth, stable Family of Apps margins, improved messaging monetisation, evidence that new compute investment generates attractive incremental returns, credible Reality Labs progress and lower net diluted share count.
Adverse signals: deteriorating advertiser outcomes, declining engagement, persistent legal restrictions, accelerated GPU replacement cycles, rising Reality Labs losses, debt-funded distributions and higher discount rates.
15. Risk matrix
| Risk | Financial mechanism | Monitoring indicator |
|---|---|---|
| Advertising cyclicality | Lower demand and prices | Average ad price and sales growth |
| Short-video competition | Weak engagement | Impressions, usage and format mix |
| Privacy and regulation | Higher costs, targeting restrictions | Official rulings and ad performance |
| AI capital intensity | Lower FCF, more depreciation | Capex/OCF, D&A, useful lives |
| Reality Labs | Persistent segment losses | Segment revenue, operating result |
| Share dilution | Lower owner cash flow per share | Diluted share count, compensation |
| Higher required return | Lower present value | WACC and terminal sensitivity |
16. Frequently asked investor questions
How does Meta earn most of its money?
Primarily through digital advertising across Family of Apps. Advertising represented approximately 97.6% of FY2025 sales. [1]
Is Instagram more profitable than Facebook?
Not independently demonstrable: Meta does not disclose audited operating profit separately for those apps.
Does Meta pay dividends?
Yes. Future payments remain subject to board decisions.
Is Reality Labs profitable?
No. Its FY2025 operating loss was approximately $19.193 billion. [1]
Is AI already improving monetisation?
Meta reports ad growth and management describes AI-driven improvements, but a separately measured AI-attributable profit contribution is not disclosed.
Is the share attractive near the 19 October 2026 reference price?
Undetermined. The newer illustrative Base case depends on major future capex normalisation and an unverified equity bridge and diluted-share denominator; it is not an investable price target.
17. Editorial conclusion and outstanding verification
Meta has a remarkably profitable and widely distributed advertising platform, alongside material opportunities and funding demands in AI, messaging and Reality Labs. Business quality and an attractive purchase price are different questions.
Current assessment: a definitive Buy/Sell opinion cannot be justified from the preliminary valuation. The next revision must resolve the remaining market-price feed discrepancy, diluted-share denominator, lease and financing reconciliation, cash returns on capex, historical 2016–2023 series, legal-case status and peer comparison. Q3 2026 reporting, scheduled for 21 October, was not yet available at the research cutoff. [3]
This draft preserves the findings and limitations in the source PDF dated 20 October 2026. It has not been expanded with unverified new data. The tables are extracts and calculations from the supplied research, not an independent financial audit.
Sources and research context
[1] Meta Platforms FY2025 Form 10-K
[3] Meta Investor Relations events calendar
[5] Stock Analysis, historical META quotes and ChartExchange, META historical quotes.
Meta revenue, 2023–2025
FY2023–FY2025, USD billions. Source: Meta FY2025 Form 10-K; reported figures.
- 2023134.9 USD billions
- 2024164.5 USD billions
- 2025200.97 USD billions
Meta operating income, 2023–2025
Source: Meta FY2025 Form 10-K; consolidated operating income.
- 202346.75 USD billions
- 202469.38 USD billions
- 202583.28 USD billions
Meta-defined free cash flow, 2023–2025
Operating cash flow minus purchases of property and equipment and finance-lease principal; 2023–2025 annual disclosures.
- 202343.01 USD billions
- 202452.1 USD billions
- 202543.59 USD billions
Meta cash capex plus finance-lease principal, 2023–2025
Cash PP&E purchases plus finance-lease principal, USD billions; Meta annual reports.
- 202328.1 USD billions
- 202439.23 USD billions
- 202572.22 USD billions
Sources & references
Found an error? Contact us with the source and passage to correct.