Companies & Stocks
Tesla in 2026: Can Autonomy and AI Justify the Stock’s Price?
An independent financial review of Tesla’s automotive, energy, autonomy and robotics prospects.
Key takeaways
- Tesla’s business combines established automotive and energy operations with significant yet uncertain autonomy and robotics options.
- The gap between bear, base and bull valuations highlights sensitivity to margins, growth, dilution and terminal value.
- Reverse DCF tests the operating outcomes implied by the reference market price.
- This article and technical appendix remain unapproved pending independent financial and editorial verification.
Tesla in 2026: Can Autonomy and AI Justify the Stock’s Price?
World in Stats | Editorial draft | 26 October 2026
Reference: $372.22 per share, 23 October 2026 close | NASDAQ: TSLA
Status: conditional — corrections required. The valuation is illustrative and the capitalization bridge requires further work before publication.
Executive summary
Tesla is both a major electric-vehicle manufacturer and an investor in energy storage, software, autonomy and robotics. The central question is how much future success investors are already paying for.
In the third quarter of 2026 Tesla reported $28.05bn of revenue, $718m of operating income and $787m of GAAP net income attributable to common stockholders. In the latest trailing twelve months, the company generated approximately $3.30bn of operating cash flow after capital expenditures. Those figures provide a starting point for evaluating expectations; they do not by themselves capture the future value of new products. [Q3; Deck]
Our illustrative scenarios range from approximately $25 to $390 per share, with a base case of $110. At the reference price, a reverse DCF using the base margin and capital assumptions requires approximately 30.8% annual revenue growth for ten years. Neither the scenarios nor that implied growth rate are forecasts or guarantees.
How Tesla earns money
Tesla generates revenue from vehicle sales and leases, regulatory credits, energy generation and storage, and services. For the first nine months of 2026 automotive revenue was $57.31bn, energy revenue $8.43bn and services/other revenue $12.93bn. Automotive remains the largest source of sales. [Q3]
Some revenue can be more persistent than vehicle purchases, but the company does not disclose a stand-alone profit margin for every software product. Full Self-Driving (Supervised) requires active driver supervision. It should not be confused with fully autonomous operation or with a proven driverless fleet at scale.
A demanding competitive landscape
AI-generated editorial illustration; visual elements and displayed figures are illustrative, not verified financial data.
Tesla benefits from a recognized brand, engineering expertise, charging infrastructure and an established fleet. Competitors are improving products and manufacturing, while interest rates, trade barriers, vehicle incentives and battery supply influence demand and profitability.
In Q3 2026 vehicle deliveries fell 2% year on year to 486,532, while automotive revenue declined 3%. Tesla reported a strong backlog but did not provide an independently verified backlog count. Regulatory credits also fell sharply, reducing a historically high-margin revenue source. [Deck; Q3]
BYD and GM are relevant competitors, although direct comparisons require care. BYD’s new-energy vehicle totals include plug-in hybrids; GM’s results include different products and financial operations. A rigorous valuation comparison needs consistent treatment of financing debt, leases and minorities.
Financial performance
AI-generated editorial illustration; visual elements and displayed figures are illustrative, not verified financial data.
| Year | Revenue | Gross profit | EBIT | Net income¹ | CFO | Capex | FCF |
|---|---|---|---|---|---|---|---|
| 2016 | 7,000 | 1,599 | -667 | -675 | -124 | 1,281 | -1,405 |
| 2017 | 11,759 | 2,223 | -1,632 | -1,962 | -61 | 3,415 | -3,476 |
| 2018 | 21,461 | 4,042 | -388 | -976 | 2,098 | 2,101 | -3 |
| 2019 | 24,578 | 4,069 | -69 | -862 | 2,405 | 1,327 | 1,078 |
| 2020 | 31,536 | 6,630 | 1,994 | 721 | 5,943 | 3,157 | 2,786 |
| 2021 | 53,823 | 13,606 | 6,523 | 5,519 | 11,497 | 6,482 | 5,015 |
| 2022 | 81,462 | 20,853 | 13,656 | 12,556 | 14,724 | 7,158 | 7,566 |
| 2023 | 96,773 | 17,660 | 8,891 | 14,997 | 13,256 | 8,899 | 4,357 |
| 2024 | 97,690 | 17,450 | 7,076 | 7,091 | 14,923 | 11,342 | 3,581 |
| 2025 | 94,827 | 17,094 | 4,355 | 3,794 | 14,747 | 8,527 | 6,220 |
USD millions. FCF is operating cash flow less capital purchases, not unlevered free cash flow. Earlier share and EPS figures in the companion dataset require stock-split normalization. See the full report and source register for details.
Revenue grew substantially over the decade, but operating profit fell from $13.66bn in 2022 to $4.36bn in 2025. The latest TTM operating margin was approximately 3.35%. Tesla’s 2023 net income was affected by a material tax benefit, so it should not be treated as a normal recurring profit level.
Cash, investment and returns
At September 2026 Tesla reported $45.45bn of cash and short-term investments and $9.52bn of financial debt and finance leases. That supports resilience, but not all cash necessarily represents surplus funds available for shareholders. [Q3]
Nine-month operating cash flow was $14.90bn and capital purchases $13.01bn. Payables and accrued liabilities helped cash flow, and $3.67bn of property acquisitions appeared in liabilities as noncash investing at period end. This timing matters when judging whether recent FCF can be sustained.
An approximate 2025 ROIC proxy is 7.5%, using EBIT after a normalized tax rate and average book debt plus equity less cash and short-term investments. This is not a fully adjusted economic ROIC: non-operating assets, leases, minorities and tax treatment remain to be reconciled.
Management, incentives and SpaceX
Elon Musk is central to Tesla’s strategy, creating both execution potential and key-person risk. The 2025 CEO award consists of 423.7m restricted shares subject to market capitalization, operational and service conditions. The shares are legally issued but unearned awards are excluded from diluted EPS until earned. A $334.09 per-share offset applies at vesting. The resulting cost and dilution depend on which milestones are met and how settlement occurs. [Q3 Note 9]
Tesla’s investment in SpaceX was carried at $2.865bn at September 2026. A potential combination has been discussed, but no completed deal or agreed exchange ratio is assumed in this analysis. Related-party terms and any future dilution would need careful scrutiny. [Q3; Reuters]
Growth outlook
AI-generated editorial illustration; visual elements and displayed figures are illustrative, not verified financial data.
Tesla’s future can develop along several paths. Its vehicle business may benefit from volume growth and efficiency, but margins depend on pricing, utilization and competition. Energy storage can expand but remains subject to pricing, deployments, warranty costs and battery supply. Software and autonomy could become valuable businesses, but progress must be measured through safe commercial deployment and cash economics.
Our base case assumes 18% annual revenue growth for five years, 10% for the next five, and an operating margin rising to 18%. This is an analyst assumption, well above the latest trailing margin, and not company guidance. The bull case assumes materially stronger growth and profitability; the bear assumes slower growth and lower margins.
DCF and scenarios
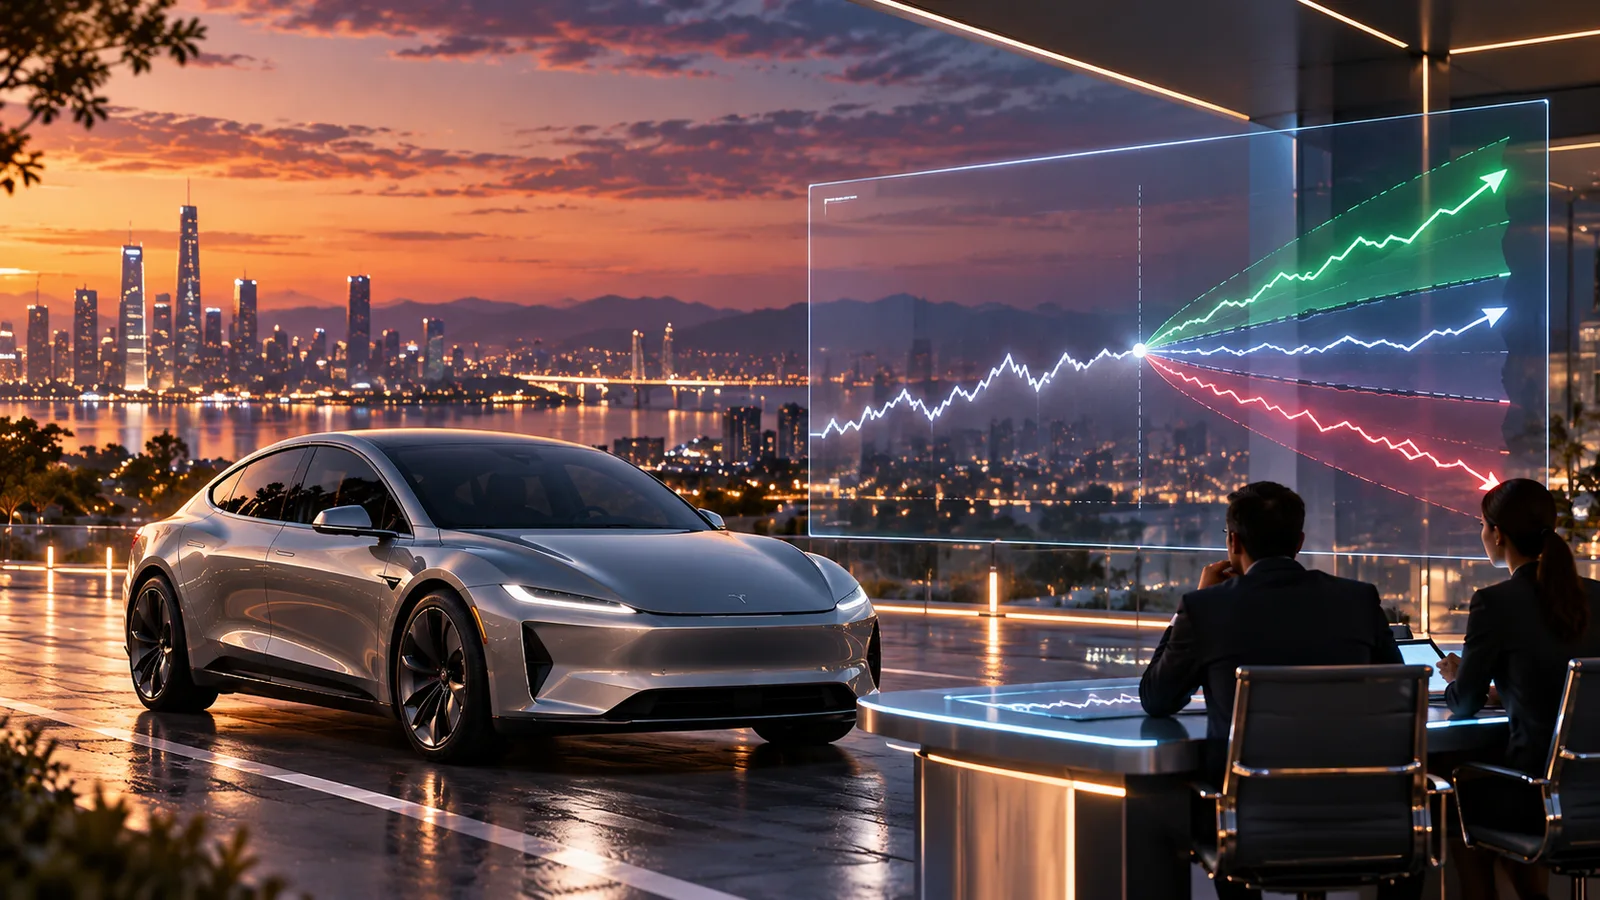
AI-generated editorial illustration; visual elements and displayed figures are illustrative, not verified financial data.
The model forecasts ten years of unlevered free cash flow and explicitly includes reinvestment for terminal growth. It begins with the latest trailing revenue, uses $20bn as a first-two-year capex floor, and applies a 10% base WACC. The capex floor is our assumption informed by the company’s 2026 outlook; it is not a forecast supplied by Tesla for each future year.
| Scenario | Growth years 1–5 / 6–10 | EBIT margin by year 5 | WACC / terminal g | Enterprise value | Equity value | USD/share |
|---|---|---|---|---|---|---|
| Bear | 8.0% / 6.0% | 10.0% | 11.0% / 2.5% | 54,717 | 88,868 | $25 |
| Base | 18.0% / 10.0% | 18.0% | 10.0% / 3.5% | 356,228 | 390,379 | $110 |
| Bull | 27.0% / 15.0% | 27.0% | 9.0% / 4.0% | 1,345,488 | 1,379,639 | $390 |
The base EV is about $356bn; after adding estimated excess cash and separately held assets and deducting debt, finance leases and minority interests, estimated equity value is about $390bn. Dividing by a 3.541bn share proxy gives roughly $110 per share. About 76% of base enterprise value comes from the terminal period.
The share denominator is Q3 diluted weighted-average shares, not a fully reconciled current capitalization. The bridge also uses September values for the SpaceX investment and digital assets, a $5bn operating-cash assumption and a book-value proxy for minority interests. Award outcomes and financing/lease economics can change the result materially.
What does the market price imply?
Under the base operating-margin and investment assumptions, reproducing the reference price requires approximately 30.8% revenue growth every year for ten years. Other combinations of growth, margins, reinvestment and discount rates can produce the same result; the share price does not reveal one uniquely implied forecast.
At the reference price the trailing earnings multiple is approximately 410× using a diluted-share proxy, while equity FCF yield is about 0.25%. These multiples use depressed current operating profitability and should not be interpreted as proof that Tesla cannot grow into its valuation. They do show how much improvement is required if current reported financial performance is the starting point.
Dividends and shareholder returns
Tesla does not currently pay a common dividend. Its investment case relies on business growth and eventual shareholder value rather than present dividend income. For an investor seeking cash distributions today, that distinction matters.
Key risks and conclusion
Risks include vehicle price competition, capital-intensive expansion, uncertain autonomous-driving approvals, product safety, compensation-related dilution, governance conflicts and a potential SpaceX transaction. A high valuation adds risk even if Tesla remains a successful business.
Tesla has strong assets and significant options for future growth. Under this draft’s base assumptions, however, the reference price is difficult to justify without substantial improvements in both revenue and operating margins. The more optimistic scenario can support the price, but it requires an outcome that has not yet been demonstrated in sustained free cash flow.
Publication limitations: independently reconcile award dilution and the capitalization table, lease/financing assets, current values of non-operating investments and normalized peer valuations. Refresh the stock price and disclosures. This is AI-assisted editorial research, not personalized investment advice or an external audit.
Full technical research report — supporting appendix
The following complete technical report is included for completeness and independent review. Its claims and valuations are not yet editorially certified.
Tesla in 2026: The Price of an AI and Autonomy Future
World in Stats | Equity Research | NASDAQ: TSLA | Research cutoff: 26 October 2026
Price: $372.22, regular-session close on 23 October 2026. Latest reported statements: quarter and nine months to 30 September 2026. USD millions unless otherwise specified.
Status: CONDITIONAL — CORRECTIONS REQUIRED. This is a working investment-committee research report, not an independently assured valuation or a publishable price target.
Executive summary
Tesla is a vertically integrated manufacturer of electric vehicles, batteries and energy-storage systems, with software, charging and services businesses. It has also invested heavily in autonomous mobility, robotics and artificial intelligence. The investment question is whether future cash profits from these projects can justify an equity value that is very large relative to the cash being produced today.
At Q3 2026 Tesla reported revenue of $28.05bn, operating income of $718m and GAAP net income attributable to common shareholders of $787m. The quarter’s automotive revenue fell 3% and operating income fell 56% from a year earlier, even as gross margin improved. Trailing revenue reconstructed from filed data was $103.57bn, EBIT $3.47bn and free cash flow $3.30bn. Free cash flow here is operating cash flow less capital expenditure, not unlevered FCFF. [Q3; Deck]
The $372.22 reference price implies approximately $1.32tn of equity value using 3.541bn Q3 diluted weighted-average shares as a valuation proxy, rather than the reported 3.953bn legally issued shares. Those numbers are not interchangeable: legally issued shares include restricted awards not earned, and GAAP basic and diluted EPS use specific accounting rules. A fully reconciled present-date capitalization table is still needed. [Q3, cover and Note 2]
The illustrative DCF produces approximately $25 bear, $110 base and $390 bull. The range reflects radically different assumptions about growth, future margins, reinvestment and discount rates. At base margin and reinvestment assumptions, a constant annual revenue-growth rate of approximately 30.8% for ten years is required to reproduce the reference price. That is a conditional calculation, not a unique forecast of what every investor believes.
Tesla does not currently pay a common dividend. It is therefore a growth and optionality investment, not a current-income equivalent to McDonald’s. A business can succeed and shareholders can still receive poor returns if the price already assumes more success than the company delivers.
Key takeaways
- Automotive remains the largest reported revenue source; energy storage and services are significant but have different margins and capital needs.
- Reported earnings are sensitive to credits, stock compensation, investment revaluations, taxes and working capital.
- The 2025 CEO award creates conditional future dilution and must not be simply ignored or added twice.
- Unsupervised Robotaxi development is commercially promising and technically, legally and economically unproven at broad scale. FSD Supervised requires driver supervision.
- A SpaceX investment exists; discussions of a possible combination do not establish an agreed transaction or a fair exchange ratio.
- Scenario valuations are sensitive to terminal economics and should not be treated as guaranteed price targets.
1. Business model and economics
Tesla sells vehicles directly, leases vehicles, sells regulatory credits, operates energy generation and storage, and reports services and other revenue. It also offers software such as Full Self-Driving (Supervised), charging, insurance and other services. The units of analysis are not interchangeable: a vehicle sale generates a one-time product margin, while subscriptions and services may generate recurring revenue but require support, computing, insurance and further development.
For the nine months ended September 2026, automotive revenue was $57.31bn, energy $8.43bn and services/other $12.93bn, together totaling $78.67bn. Automotive credits contributed $639m; Q3 credits fell to $113m from $417m. Credit receipts historically carry little incremental cost, so declining credits can reduce gross profit disproportionate to the revenue loss. Sales of vehicles and credits cannot automatically be treated as stable recurring software revenue. [Q3, consolidated statements]
2026 Q3 deliveries were 486,532 versus 497,099 a year earlier; production was 464,391. Tesla describes the passenger-vehicle order backlog as its highest in four years and battery availability as a constraint. Backlog is a company statement, not a disclosed audited count or evidence that all orders will be delivered at profitable prices. [Deck, pp3–5]
Energy revenue fell 16% year on year in Q3 even as gross profit margin improved. Growth in deployments does not guarantee the same revenue growth: a product mix, pricing and revenue-recognition mismatch can matter. Reported services/other include several activities, so a high growth rate is not a stand-alone FSD margin disclosure. [Q3; Deck]
2. Competitive position
Tesla has advantages in brand recognition, battery systems, power electronics, manufacturing experience, direct distribution and its charging network. Its installed fleet and software provide potential feedback and distribution advantages, but access to data alone does not establish that its autonomy stack is safer, commercially superior or capable of regulatory approval. A software feature that requires a supervising driver is not proof of a driverless network.
The company faces established carmakers, low-cost Chinese manufacturers, and specialist autonomy providers. BYD reports 4.6 million 2025 new-energy vehicle sales; that figure includes plug-in hybrids and is not directly comparable with Tesla’s battery-electric deliveries. General Motors reported Q3 2026 revenues of $50.0bn and GAAP operating income of $3.6bn; its business mix, financing and geographic exposure differ materially from Tesla’s. These facts challenge the notion that Tesla competes in an uncontested market, but do not establish comparable market shares or prove relative product safety. [BYD; GM]
An expanding charging network and vertically integrated software create some ecosystem benefits. Switching costs are meaningful for a customer who values familiarity or charging access, but a buyer can still move to another brand. Lower pricing, faster product cycles and competition for batteries can erode the moat. No unverified total-addressable-market or global market-share projection is used.
3. Leadership, governance and capital allocation
Elon Musk’s leadership is central to Tesla’s product development and brand. It also creates key-person risk, competing time demands and related-party concerns. A capital-allocation decision involving companies under overlapping influence needs independent assessment, transparent terms and shareholder protections. The 2026 proxy should be reviewed for board independence, ownership and related-party disclosures; no broad conclusion about every director’s independence is asserted without a full ownership and transaction audit. [Proxy]
Tesla spent $13.01bn on property and equipment in the first nine months of 2026, versus $6.13bn a year earlier. The company’s stated full-year capital expenditure outlook was reduced to approximately $20bn. That change is management guidance, not a commitment that each subsequent year will have the same capex. Higher investment can create growth but also delay shareholder cash returns; lower investment can improve near-term FCF while slowing future capacity. [Q3; Deck; Reuters]
Tesla acquired a SpaceX interest for $2.002bn and held a recorded fair value of $2.865bn at September 30. The first nine months included an $863m unrealized gain, excluded from operating cash in the cash-flow reconciliation. This is a real balance-sheet asset but a non-operating, market-sensitive holding; it should not be presented as recurring automotive operating profit. Tesla and SpaceX have discussed a possible combination through committees, according to reporting; no signed transaction or agreed economics is assumed. A combination would introduce valuation, related-party, financing and dilution questions. [Q3, financial instruments; Reuters]
4. Ten-year financial record
| Year | Revenue | Gross profit | EBIT | Net income¹ | CFO | Capex | FCF |
|---|---|---|---|---|---|---|---|
| 2016 | 7,000 | 1,599 | -667 | -675 | -124 | 1,281 | -1,405 |
| 2017 | 11,759 | 2,223 | -1,632 | -1,962 | -61 | 3,415 | -3,476 |
| 2018 | 21,461 | 4,042 | -388 | -976 | 2,098 | 2,101 | -3 |
| 2019 | 24,578 | 4,069 | -69 | -862 | 2,405 | 1,327 | 1,078 |
| 2020 | 31,536 | 6,630 | 1,994 | 721 | 5,943 | 3,157 | 2,786 |
| 2021 | 53,823 | 13,606 | 6,523 | 5,519 | 11,497 | 6,482 | 5,015 |
| 2022 | 81,462 | 20,853 | 13,656 | 12,556 | 14,724 | 7,158 | 7,566 |
| 2023 | 96,773 | 17,660 | 8,891 | 14,997 | 13,256 | 8,899 | 4,357 |
| 2024 | 97,690 | 17,450 | 7,076 | 7,091 | 14,923 | 11,342 | 3,581 |
| 2025 | 94,827 | 17,094 | 4,355 | 3,794 | 14,747 | 8,527 | 6,220 |
¹ Net income is the SEC XBRL NetIncomeLoss fact, generally attributable to the parent in this data series; users should consult individual source statements for noncontrolling interests and older line-item classifications. Revenue, EBIT, CFO and cash capex are drawn from exact fiscal-year XBRL facts in historical_sources.csv. Early-year values can include decimal rounding. Historical EPS and weighted-average share columns in the CSV are retained as filed and may be on different stock-split bases before 2022; do not compare them without restatement. Missing older D&A, debt or short-term investment facts are blank, not zero. [SEC data]
Revenue rose from about $7.0bn in 2016 to $94.8bn in 2025, while profitability improved and then contracted sharply. EBIT peaked at $13.66bn in 2022 and fell to $4.36bn in 2025. Net income in 2023 included a large tax benefit and should not be treated as a normalized earnings base. As production scales, price and volume growth must be balanced against depreciation, factory utilization and research spending.
2025 FCF was $6.22bn, compared with $3.58bn in 2024. TTM through Q3 2026 was $3.30bn because capital spending rose substantially. A single year of CFO less capex does not include the full economic cost of acquisitions, future lease-financed assets or equity compensation. [10K; Q3; Deck]
5. Profitability and return on invested capital
The TTM EBIT margin is $3.466bn / $103.570bn = 3.35%; 2025 margin was 4.59%, compared with 16.76% in 2022. Gross margin is not EBIT margin: research, administration, restructuring and stock compensation must be paid before operating profit.
A transparent but approximate 2025 ROIC proxy is calculated as follows. NOPAT = $4,355m EBIT × (1 − 22%) = $3,397m. Operating capital proxy = parent equity + financial debt and finance leases − cash and short-term investments: 2024 $72,913m + $8,213m − $36,563m = $44,563m; 2025 $82,137m + $8,376m − $44,059m = $46,454m. Average proxy capital = $45,509m and 2025 proxy ROIC ≈ 7.5%. [10K, balance sheets]
This is a rough return on book capital, not an independently normalized ROIC. It excludes operating lease liabilities, does not remove non-operating investments or reconcile minority interests, uses a standard 22% tax assumption, and is sensitive to carrying values. 2025 Q3/Q4 economics and incentive credits complicate NOPAT. An economic-profit claim against WACC requires an improved capital and tax bridge. 2025 ROE is approximately 4.9% using $3.794bn parent income over average 2024–25 parent equity, but it is also affected by unusually low earnings and investment gains. Incremental ROIC is not calculated from one-year differences because large construction projects have multi-year lags.
6. Balance sheet, cash and quality of earnings
On 30 September 2026 Tesla held $17.853bn cash and $27.594bn short-term investments, or $45.447bn combined. Current debt and finance leases were $1.387bn and noncurrent debt and finance leases $8.136bn. The simple difference is approximately $35.924bn net cash before other liabilities, minority interests and minimum operating liquidity. Working capital current ratio was 70,402 / 40,492 = 1.74×. These are accounting positions, not proof all investments are unrestricted excess cash. [Q3]
Nine-month CFO of $14.897bn reconciles to $2.423bn consolidated net income with $5.061bn depreciation/impairment, $3.346bn SBC, other noncash adjustments and working-capital changes. Accounts payable/accruals contributed $7.332bn, while inventory consumed $1.976bn and prepaid/other assets consumed $2.846bn. Growth in payables can support CFO temporarily; the model must not annualize a favorable cash conversion as if it were pure operating improvement. [Q3 cash-flow statement]
Nine-month capital purchases of $13.014bn are shown excluding finance leases and net of sales; $3.667bn of property acquisitions remained in liabilities as noncash investing at the reporting date. These are not additional cash capex in the period, but they are a reminder that the timing of supplier payments can shift reported FCF. The $2.002bn SpaceX investment is also excluded from the company’s operating FCF definition. SBC is a real economic ownership cost: it stays in EBIT in the FCFF model and is not added back as free value.
Deferred tax assets of $7.908bn depend on realizability assumptions. Unrealized SpaceX and digital-asset valuation moves, regulatory credits, insurance/financing receivables, warranties, residual-value exposure, related-party agreements and deferred FSD revenue require continued attention. GAAP income and non-GAAP income differ substantially; removing recurring SBC without accounting for dilution can mislead. Allegations in litigation are not findings of wrongdoing. The Q3 filing describes ongoing legal cases and investigations; its outcomes remain uncertain. [Q3 Notes 2, 11]
7. CEO compensation and dilution
The 2018 CEO award was reinstated by the Delaware Supreme Court. During Q2 2026 Musk exercised approximately 304m options and net-settled about 17.5m shares for the exercise price, leaving restricted shares subject to continued service through January 2028. The separate 2025 interim award of 96m shares was forfeited. [Q3 Note 9]
The 2025 CEO performance award consists of 423,743,904 restricted shares in 12 tranches. Each tranche requires market-capitalization and operational milestones and eligible service. First market-cap milestone is $2tn; the final milestone is $8.5tn, with specific measurement periods. The stock is already legally issued but unearned restricted shares are excluded from diluted EPS until earned. At vesting, an offset of $334.09 per share applies unless paid in cash. Therefore multiplying 423.7m by the current share price and adding the full amount as a present cash cost or simply adding 423.7m to the GAAP issued share count would both be misleading. [Q3 Note 9]
For perspective only, at a hypothetical $500 share price a cashless offset would represent roughly 423.744m × (1 − $334.09 / $500) = 140.6m net shares if all tranches vested and settled that way. That hypothetical assumes an outcome that has not happened and ignores other conditions; not every tranche becomes eligible at $500. At $372.22 the same purely mechanical formula is about 43.4m net shares, but it is not evidence that any tranche is currently earned. Award outcomes and potential tax deductions should be modeled by tranche and scenario before publishing a precise value.
8. Drivers and forecasts
Vehicles: volume, mix and selling price jointly determine revenue and margin. Battery availability, competition, factory utilization, tariffs, consumer financing costs and tax incentives influence both. Growth in deliveries at lower average prices may not translate into proportional profit growth.
Energy: storage deployments, price per unit, warranty performance and supply chains matter. Services and software: active FSD subscriptions reached 1.74m in Q3, according to Tesla. That count includes supervised software subscriptions and does not by itself disclose autonomous-ride profits or net customer retention. [Deck]
Robotaxi and Optimus: scale requires demonstrable safe performance, approvals, viable unit economics, manufacturing capacity and customer demand. A launch or prototype is evidence of progress, not a guarantee of large future cash flows. The scenarios include a range of potential economics but do not attach an unsupported separate trillion-dollar value to these activities.
The base forecast assumes 18% annual consolidated revenue growth in years 1–5 and 10% in years 6–10, with GAAP-like operating margin reaching 18% in year 5. This is aggressive relative to the current 3.35% TTM margin and is an analyst scenario, not Tesla guidance or consensus. The bear case assumes 8%/6% growth and 10% margin; the bull 27%/15% and 27% margin, requiring materially stronger autonomy/software economics and execution. These are deliberately different business outcomes, not assigned probabilities.
9. DCF construction
Ten forward rolling years begin after the 23 October 2026 valuation date. Starting revenue is the latest TTM $103.57bn; Q3 data are a stale-but-observed anchor, not a forecast of the latest quarter repeated. The model applies:
Revenue[t] = Revenue[t−1] × (1 + growth)
NOPAT = EBIT × (1 − normalized tax rate)
FCFF = NOPAT + depreciation − cash capex − incremental operating working capital
Terminal FCFF = NOPAT[11] × (1 − terminal growth / terminal ROIC)
EV = PV(forecast FCFF) + PV(terminal FCFF / (WACC − terminal growth)).
Base assumptions include 22% tax, D&A 6.5% of revenue, capex the larger of $20bn or 11% of revenue in the first two forward years and 11% thereafter, and working-capital investment equal to 6% of incremental revenue. The $20bn floor draws on management’s 2026 guidance but is an independent conservative assumption for forward rolling years, not 2026 fiscal-year guidance repeated as fact. It does not separately forecast acquisitions, extraordinary finance-lease asset additions, SBC settlement costs or the merger. This omission and capital-intensity uncertainty are material.
WACC is 10% base, 11% bear and 9% bull; 3.5%, 2.5% and 4% terminal growth respectively. The October 23 US Treasury 10-year par yield was 5.00%. As an illustrative base cost of equity, 5% risk-free + 1.0 assumed beta × 5% assumed equity premium = 10%; a cash-rich structure makes the model’s rounded 10% WACC a practical sensitivity assumption rather than a precise observed capital-market estimate. Beta, ERP, marginal debt cost and target capital structure need independent market-data calibration. Terminal ROIC of 20% base implies reinvesting 17.5% of terminal NOPAT to support 3.5% growth. [Treasury]
Base forecast (USD millions)
| Year | Revenue | EBIT margin | NOPAT | D&A | Capex | Δ working capital | FCFF |
|---|---|---|---|---|---|---|---|
| 1 | 122,213 | 6.3% | 5,984 | 7,944 | 20,000 | 1,119 | -7,191 |
| 2 | 144,211 | 9.2% | 10,357 | 9,374 | 20,000 | 1,320 | -1,589 |
| 3 | 170,169 | 12.1% | 16,112 | 11,061 | 18,719 | 1,557 | 6,897 |
| 4 | 200,799 | 15.1% | 23,602 | 13,052 | 22,088 | 1,838 | 12,728 |
| 5 | 236,943 | 18.0% | 33,267 | 15,401 | 26,064 | 2,169 | 20,436 |
| 6 | 260,637 | 18.0% | 36,593 | 16,941 | 28,670 | 1,422 | 23,443 |
| 7 | 286,701 | 18.0% | 40,253 | 18,636 | 31,537 | 1,564 | 25,787 |
| 8 | 315,371 | 18.0% | 44,278 | 20,499 | 34,691 | 1,720 | 28,366 |
| 9 | 346,908 | 18.0% | 48,706 | 22,549 | 38,160 | 1,892 | 31,203 |
| 10 | 381,599 | 18.0% | 53,577 | 24,804 | 41,976 | 2,081 | 34,323 |
Valuation scenarios
| Scenario | Growth years 1–5 / 6–10 | EBIT margin by year 5 | WACC / terminal g | Enterprise value | Equity value | USD/share |
|---|---|---|---|---|---|---|
| Bear | 8.0% / 6.0% | 10.0% | 11.0% / 2.5% | 54,717 | 88,868 | $25 |
| Base | 18.0% / 10.0% | 18.0% | 10.0% / 3.5% | 356,228 | 390,379 | $110 |
| Bull | 27.0% / 15.0% | 27.0% | 9.0% / 4.0% | 1,345,488 | 1,379,639 | $390 |
At the base case approximately 76.2% of enterprise value comes from the terminal period, emphasizing the dependence on economics beyond ten years. Scenarios also vary WACC; compare at a constant rate when isolating operating outcomes. The negative or low near-term FCFF in some scenarios is an intended consequence of high reinvestment and low starting operating profit.
Enterprise-to-equity bridge: base case
| Item | USD millions |
|---|---|
| PV explicit forecast | 84,879 |
| PV terminal value | 271,349 |
| Enterprise value | 356,228 |
| Cash plus short-term investments | 45,447 |
| Less assumed required operating cash | (5,000) |
| SpaceX investment at September carrying fair value | 2,865 |
| Digital assets at September carrying value | 962 |
| Financial debt and finance leases | (9,523) |
| Redeemable plus noncontrolling interests, book proxy | (600) |
| Equity value | 390,379 |
| Diluted weighted-share proxy | 3,541m |
| Per share | $110 |
Interest income and investment mark-to-market are below operating income, so cash and SpaceX are added separately rather than also including their returns in forecast EBIT. Operating-lease expense remains in EBIT and operating lease liabilities are not separately deducted; finance leases are treated as debt. The required $5bn cash reserve is a judgment, and minority book value is a proxy, not fair value. SpaceX and digital asset values are September balance-sheet values, not independently updated October quotes. Finance-lease replacement investment and financing receivables require a deeper reconciliation. Consequently the bridge is mechanically explicit but economically provisional.
Sensitivity: base assumptions
| WACC | g 3.0% | g 3.5% | g 4.0% |
|---|---|---|---|
| 9.0% | $129 | $135 | $142 |
| 9.5% | $117 | $121 | $127 |
| 10.0% | $107 | $110 | $115 |
| 10.5% | $98 | $101 | $104 |
| 11.0% | $90 | $93 | $95 |
10. Reverse DCF
| WACC | Margin at year 5 | Constant implied revenue growth |
|---|---|---|
| 9.0% | 15.0% | 30.4% |
| 9.0% | 18.0% | 27.7% |
| 9.0% | 25.0% | 22.9% |
| 9.0% | 30.0% | 20.3% |
| 10.0% | 15.0% | 33.7% |
| 10.0% | 18.0% | 30.8% |
| 10.0% | 25.0% | 25.8% |
| 10.0% | 30.0% | 23.2% |
| 11.0% | 15.0% | 36.6% |
| 11.0% | 18.0% | 33.6% |
| 11.0% | 25.0% | 28.5% |
| 11.0% | 30.0% | 25.7% |
The table solves for one constant 10-year growth rate under different WACC and year-five margin targets. Other base assumptions, including capital intensity, terminal reinvestment and the share proxy, are held fixed. At 10% WACC and an 18% eventual operating margin, growth of approximately 30.8% a year reproduces $372.22. That implies year-ten revenue of about $1.51tn from a $103.57bn starting point. Such a result is a mathematical illustration of demanding assumptions, not a prediction that consensus expects this precise path. Different margins, capital intensity, discount rates and real options can yield the same price.
The reverse model does not jointly identify revenue growth, margins and reinvestment. A unique implied autonomous-driving adoption rate or robot count cannot be inferred from a share price without additional assumptions. In particular, using a high software margin while omitting the investment and dilution needed to achieve it would inflate value.
11. Relative valuation and dividends
Using $372.22 × 3.541bn shares gives a proxy market equity value of $1.318tn. This is not a fully reconciled October market capitalization. Market equity divided by trailing $3.218bn parent net income gives an indicative 410× earnings. The ratio is distorted by a low earnings base, investment gains and the share proxy. TTM equity FCF yield is approximately 0.25% ($3.303bn / $1.318tn), before acquisition spending or additional equity costs. The model’s EV, using the explicit debt/cash/non-operating adjustment, is roughly $1.284tn or 370× TTM EBIT. These indicators describe current reported cash and profits, not fair value.
GM and BYD offer useful business comparisons but differ in financing subsidiaries, product types and corporate structures. Same-date peer EV, adjusted debt, minorities, lease treatment and consensus forecasts are not fully reconciled here; a peer P/E or EV/EBIT table is therefore deliberately not asserted as verified. Nor are forward P/E, historic trading percentiles or peer ROIC inferred from different reporting bases. This is a publication limitation requiring completion.
Tesla has no current cash dividend or dividend yield under the examined filings. Shareholders depend on future cash generation, any eventual distributions and changes in market valuation. As a complement to a dividend portfolio, it provides growth exposure and volatility rather than current income. No personalized recommendation or allocation is made. [10K]
12. Risks and counterarguments
| Risk | Mechanism / metric | Leading evidence | Mitigant and limitation |
|---|---|---|---|
| EV demand and pricing | Price cuts and mix compress automotive margin | Deliveries, inventory days, average prices, credits | Brand, scale and cash help; rivals can sustain price pressure |
| Autonomy safety and regulation | Accidents, recalls, operating limits or litigation slow deployment | Independent safety data, approvals, paid rides, disengagement reporting | Phased tests can reduce errors, but supervised data do not prove driverless safety |
| Speculative valuation | Margin, growth or discount-rate misses compress multiples | FCF, operating margin, bond yields | Cash provides cushion; it is small relative to market equity |
| Capital intensity | Factories, AI compute and robot production absorb cash before returns | Capex, working capital, ROIC and asset utilization | Staged investment can preserve liquidity; delays erode expected growth |
| Equity compensation | Awards transfer future value or dilute holders | Tranche milestones, proxy, fully diluted capitalization | Performance conditions and offset reduce some dilution; not zero cost |
| CEO and related parties | Attention, conflicts, terms or control affect strategy | Related-party disclosures, independent review, transaction terms | Committees and votes can help; fairness still needs verification |
| SpaceX transaction | Exchange ratio or financing could transfer value and alter risk | Filed proposals, fairness opinion, voting and funding | No deal is assumed; a future deal may materially change the thesis |
| Regulatory credits and subsidies | Reduced credits increase effective cost of sales | Credit revenue and policy changes | Diversified revenue; policy dependency persists |
| Energy/storage execution | Warranty, price/mix and supply constraints affect margin | Deployments, recognized revenue, gross profit, recalls | Product demand may grow, but deployments are not profit |
| Cybersecurity and product safety | Data breaches, recalls or defects create claims and harm trust | Recalls, incident data, regulator updates | Testing and controls cannot eliminate exposure |
| FX, tariffs and geopolitical risks | Cost and local demand change abruptly | Regional sales, tariff decisions, FX and production footprint | Local manufacturing helps but adds fixed costs |
The strongest bear case is not that electric vehicles disappear. It is that Tesla remains a successful manufacturer while autonomy, robotics and energy require far more capital and time than investors expect. In that outcome a high current multiple can fall faster than profits rise. The strongest bull case is that Tesla converts its distribution, engineering and software base into a high-margin platform at a scale far beyond today’s vehicle economics. The evidence required is sustained, independently observable commercial cash generation, not promises alone.
13. Conditional investment assessment
Tesla has substantial strategic assets, engineering capability and a strong liquidity position. Current operating profit and FCF are small relative to the reference equity valuation; the stock therefore requires substantial future growth and/or new economic engines. In this draft the base scenario does not support the reference price, while the bull scenario roughly does. That does not establish that either outcome is probable.
The thesis improves if delivery growth is achieved without persistent margin concessions, energy earnings scale, autonomy earns recurring cash after safety and regulatory costs, and new capital earns verifiable returns. It deteriorates if per-unit economics weaken, capex produces slow returns, dilution expands, or a related-party transaction shifts value away from Tesla holders. Investors focused on dividend income should recognize that Tesla currently provides none.
14. Sources, methodology and publication conditions
The source register documents original links and periods. Financial history uses SEC XBRL facts; exact tags and filing accessions are in historical_sources.csv. Q3 statements and investor presentation were examined directly. The analysis and article use the 23 October closing price; they should be refreshed before publication. Tesla has issued new annual-meeting proxy materials, while transaction and operating developments can change quickly.
The computational audit verifies arithmetic and independent Decimal reconstruction, not the realism of forecasts. Remaining work includes a legally accurate period-end diluted share and milestone model, non-operating asset and financial-subsidiary/lease reconciliation, peer valuation normalization, historical share split normalization and a complete SEC amendment/event inventory. A final editorial and ownership-conflict review is required. No publication, deployment or repository change was performed.
Disclosure: AI-assisted research; not external assurance or personalized investment advice. The publisher must disclose actual holdings, financial relationships and image rights before publication.
Tesla annual revenue
Values reproduced from Work historical_financials.csv; must be verified against primary filings.
- 20167,000.13 USD million
- 201711,759 USD million
- 201821,461.27 USD million
- 201924,578 USD million
- 202031,536 USD million
- 202153,823 USD million
- 202281,462 USD million
- 202396,773 USD million
- 202497,690 USD million
- 202594,827 USD million
Tesla illustrative DCF scenarios
Bear, base and bull scenario outputs from ChatGPT Work; conditional, not independently validated target prices.
- Bear25.1 USD per share
- Base110.25 USD per share
- Bull389.62 USD per share
Sources & references
Found an error? Contact us with the source and passage to correct.